Download
1 / 24
240 likes | 374 Views
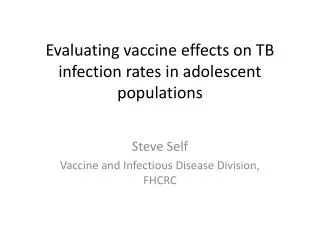
Evaluating vaccine effects on TB infection rates in adolescent populations. Steve Self Vaccine and Infectious Disease Division, FHCRC. Outline. Introduction: Why infection endpoint? Modeling exposure to infection: what are risks for attenuating biological vaccine effect?

E N D
Evaluating vaccine effects on TB infection rates in adolescent populations Steve Self Vaccine and Infectious Disease Division, FHCRC
Outline • Introduction: Why infection endpoint? • Modeling exposure to infection: what are risks for attenuating biological vaccine effect? • Overview of possible trial designs • Discussion
Why an infection endpoint? • it’s NOT a clinical endpoint • “a direct measure of how a person functions, feels and survives” –Bob Temple • it’s NOT a surrogate endpoint • a validated biomarker predictive of clinical effect
Why an infection endpoint? • it’s NOT a clinical endpoint • “a direct measure of how a person functions, feels and survives” –Bob Temple • it’s NOT a surrogate endpoint • a validated biomarker predictive of clinical effect • it IS a measure of biologic activity • it IS weakly predictive of risk for clinical disease • it IS an appropriate endpoint for Phase II trials
Why an infection endpoint? • HPV vaccine as illustrative example • Clinical endpoint (CIN2/3) is rare and occurs long after infection – Ph IIB/III trials large and $$$s • No known correlate of protection so plausibility for clinical vaccine efficacy difficult to argue from immunogenicity alone • Hope for effect from post-infection vaccination but count on pre-infection • Phase II test-of-concept trials used persistent HPV infection endpoint to develop stronger evidence for plausible clinical efficacy • Long term follow up provided early evidence of persistent infection as a valid surrogate • Hope for post-infection vaccine effect was dashed
Is VES* plausible for TB vaccines? • Yes but not for vaccine candidates of this generation? (Kaufmann, 2012) • Animal challenge models still difficult to interpret relative to human exposures • Some epidemiologic data weakly supporting plausible vaccine effect (BCG and IGRA) * VES = vaccine efficacy to reduce infection rate (S = susceptibility) per Halloran et al (1996)
Epidemiologic Studies (2002-2009):BCG / IGRA Association Soyal, 2005Turkey (979) Hill, 2006The Gambia (718) Hill, 2007The Gambia (207) Eisenhut, 2009 UK (199) Lucas, 2010 Australia (524) Roy, 2012 Europe (1128) Weak evidence (non-RCT, mixed) for BCG reducing rate of IGRA conversion 0.0 0.5 1.0 1.5 2.0 Odds Ratio (95% CI)
Is VES* plausible for TB vaccines? • Yes but not for vaccine candidates of this generation (Kaufmann, 2012) • Animal challenge models still difficult to interpret relative to human exposures • Some epidemiologic data supporting plausibility (BCG and IGRA) • But VES ≈ 0 in recent infant trial • D in infant vs adolescent immune responses? • D in nature of exposure? * VES = vaccine efficacy to reduce infection rate (S = susceptibility) per Halloran et al (1996)
Modeling TB exposure/infection • A biological effect at point of infection in lung might be attenuated via • rate of repeated exposure events over time • variability in infectious potential per event • Strain differences • Variation in # droplet micronuclei • Difficult to study directly; little is known • But a simple model, calibrated to known infection rate (eg 5%/yr) could answer “what if” questions
Prob of infection given exposure with infectious potential q τ = 0.95 τ = 0.50 τ = 0.10 P(q;τ) τ = 0.01 P(q;τ): A family of curves, indexed by a parameter τ, that Translates an exposure event with infectious potential q to a probability that exposure will lead to a stable infection. Average of P(q;τ) over assumed distribution of q gives unconditional probability of stable infection for a single exposure Infectious Potential (q)
Prob of infection given exposure with infectious potential q P(q;τ) Distribution of Infectious Potential (q) per exposure Infectious Potential (q)
Rate of exposure and calibration • Assume a distribution for rate of exposure over time (N = # exposure events / year) • Average P(q;τ) over distributions of q AND N to compute expected annual rate of infection • Find which of the P(q;τ) curves (which value of τ), when averaged over q and N match the epidemiologic annual rate of infection
Contour plot of values for τ calibrated to 5%/yr incidence Expected Infectious Potential q (log-scale) Too little exposure to be consistent with 5%/yr Expected # exposure events per year (log-scale) • There must be sufficient exposure to be consistent with assumed incidence • For increased rate and/or infectious potential of exposure, the per-exposure probability of infection must decrease to remain consistent with assumed incidence
Model for Vaccine Effect (τ reduced by 60%) Now can compute VES for under assumed exposure model and calibrated to relevant epidemiologic incidence rate 1 – infection rate for vaccinees / infection rate for controls
Contour plot of values for VES calibrated to 5%/yr incidence τ = 0.60 0.41 0.47 0.53 0.35 Expected Infectious Potential q (log-scale) Too little exposure to be consistent with 5%/yr Expected # exposure events per year (log-scale) Principle risk for attenuating biological effect is rare exposure with overwhelming infectious potential (rather than) a high rate of exposure over time
Phase II trial designs with infection endpoints • Test of concept trial • Focus on testing VES > 0 • Tight control of false positive rate (0.025 1-sided) • Screening trial • Focus on testing VES > 0 • Willing to tolerate increased false positive error for better power • Ranking/selection trial • As secondary add-on to either TOC or screening • Based on VES, select best among multiple vaccines that pass initial efficacy testing stage
Required Total # Endpoints (split) Design with Type 1 and Type 2 errors balanced
Required Total # EndpointsProbability of passing VEScriterion, Probability of selection Prob of passing efficacy test Prob of selected as best
IGRA: An imperfect test for TB infection • Impact on screening at baseline • Recent infections may be IGRA negative at baseline • Equal rates of prevalent infection between groups will attenuate estimated VES • If 95% convert to IGRA+ within 6 weeks of infection then 3 month delay in counting endpoint (eg per-protocol analysis) will remove bias • Impact on attenuation of VES • High specificity is good news • Reversion phenomenon?
True VE = 60% VE PP VE ITT • At 1 year: • VE PP ~ 58% • VE ITT ~ 44% • = 0.05 (annual incidence of infection) • = 2 weeks (95% convert within 6 weeks) • = expected time from infection to IGRA positivity • 3 mo vaccination window
Discussion • Searching under the lamp post? • Potential contributions to search for immune correlates • Strategy for current or for next generation vaccines?
P(q;τ) Distribution of Infectious Potential (q) per exposure Infectious Potential (q)
Evaluating vaccine effects on TB infection rates in adolescent populations