Download
1 / 18
180 likes | 332 Views
Understanding Price Discovery in the Stock Market – By Prof. Simply Simple TM. How does price discovery take place in the stock market?. Let’s say a company makes Rs. 1000 as profit Also, let’s assume the company has 100 shares

E N D
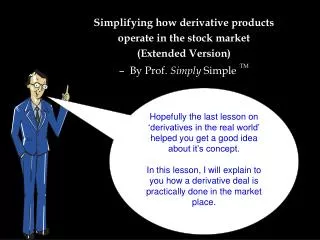
Understanding Price Discovery in the Stock Market– By Prof. Simply Simple TM How does price discovery take place in the stock market?
Let’s say a company makes Rs. 1000 as profit • Also, let’s assume the company has 100 shares • So earnings per share (EPS) i.e. profit/no. of shares = Rs. 1000/100 = 10 • Let’s say the price per share in the market is Rs. 100 • Then the P/E would be Price of share / Earnings per share 100/10 =10
Since P/E = 10, it means a buyer, Mr. Pickle is willing to pay 10 times the company’s annual earnings per share!
This means that the buyer would take 10 years to recover his cost of buying.
However 10 yrs seems a long time to recover his investment. So what’s his motivation for investing?
Let’s say there is a surge in the demand for the company’s product causing its profits to go up from Rs 1,000 to Rs 10,000!
Now what’s interesting to observe is that while the profit went up from Rs 1000 to Rs 10,000 the number of shares remains the same at 100. Hence, by definition, earnings per share would be Rs.100.
Since Mr. Pickle invested Rs 100 for a share whose EPS has increased from Rs 10 to Rs 100, he is now able to recover his investment within a year.
Assuming the P/E remains at was 10 and earnings per share has gone up to Rs 100, the price of the share would then be Rs. 1000.
Hence Mr Pickle who paid Rs 100 per share could sell the same for Rs 1000 and make a profit of Rs 900. But the story does not end here.
When people see that a company, which was making Rs 10 per share sometime back, is now making Rs 100 per share, they all want to buy the shares of this company and thus the demand shoots up!
And this demand causes the P/E to go up from 10 to let’s say 12.
When the P/E moves up from 10 to 12, the market price of the shares too move up to Rs 1200 from 1000.
Now Mr. Pickle, who had initially bought a share for Rs 100, can now sell the same for Rs 1200 and make a profit of Rs 1100!
Thus we have seen how the price of a share is discovered in the market. It is a function of both the earnings per share which is the profitability of the company as well as the sentiments, expectations of the market causing demand to rise which increases the P/E ratio!
Hopefully you’ve now understood the conceptual interpretation of the P/E ratio and how it changes depending on earnings of the company at one hand and demand on the other!
I will be glad to receive your feedback on this lesson to understand if there any gaps. Your feedback will help me improve my lessons going forward. Also if you wish to demystify any other concepts, do write to me about them. Please send your feedback to professor@tataamc.com
Disclaimer The views expressed in these lessons are for information purposes only and do not construe to be of any investment, legal or taxation advice. The contents are topical in nature & held true at the time of creation of the lesson. They are not indicative of future market trends, nor is Tata Asset Management Ltd. attempting to predict the same. Reprinting any part of this presentation will be at your own risk and Tata Asset Management Ltd. will not be liable for the consequences of any such action.