Download

1 / 67
670 likes | 784 Views
Working With Financial Statements. Key Concepts and Skills. Understand sources and uses of cash and the Statement of Cash Flows Know how to standardize financial statements for comparison purposes Know how to compute and interpret important financial ratios

E N D
Key Concepts and Skills • Understand sources and uses of cash and the Statement of Cash Flows • Know how to standardize financial statements for comparison purposes • Know how to compute and interpret important financial ratios • Be able to compute and interpret the DuPont Identity • Understand the problems and pitfalls in financial statement analysis
Chapter Outline • Cash Flow and Financial Statements: A Closer Look • Standardized Financial Statements • Ratio Analysis • The DuPont Identity • Using Financial Statement Information
Sample Balance Sheet Numbers in millions
Sample Income Statement Numbers in millions, except EPS & DPS
Sources and Uses • Sources • Cash inflow – occurs when we “sell” something • Decrease in asset account (Sample B/S) • Accounts receivable, inventory, and net fixed assets • Increase in liability or equity account • Accounts payable, other current liabilities, and common stock • Uses • Cash outflow – occurs when we “buy” something • Increase in asset account • Cash and other current assets • Decrease in liability or equity account • Notes payable and long-term debt
Statement of Cash Flows • Statement that summarizes the sources and uses of cash • Changes divided into three major categories • Operating Activity – includes net income and changes in most current accounts • Investment Activity – includes changes in fixed assets • Financing Activity – includes changes in notes payable, long-term debt, and equity accounts as well as dividends
Sample Statement of Cash Flows Numbers in millions
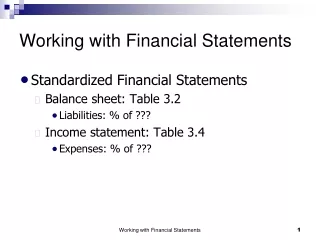
Standardized Financial Statements • Common-Size Balance Sheets • Compute all accounts as a percent of total assets • Common-Size Income Statements • Compute all line items as a percent of sales • Standardized statements make it easier to compare financial information, particularly as the company grows • They are also useful for comparing companies of different sizes, particularly within the same industry
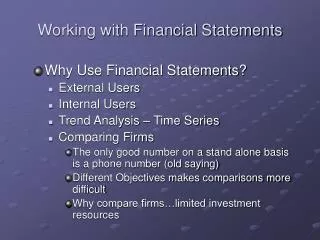
Ratio Analysis • Ratios also allow for better comparison through time or between companies • As we look at each ratio, ask yourself what the ratio is trying to measure and why that information is important • Ratios are used both internally and externally
Categories of Financial Ratios • Short-term solvency or liquidity ratios • Long-term solvency or financial leverage ratios • Asset management or turnover ratios • Profitability ratios • Market value ratios
Computing Liquidity Ratios • Current Ratio = CA / CL • 2,256 / 1,995 = 1.13 times • Quick Ratio = (CA – Inventory) / CL • (2,256 – 301) / 1,995 = .98 times • Cash Ratio = Cash / CL • 696 / 1,995 = .35 times • NWC to Total Assets = NWC / TA • (2,256 – 1,995) / 5,394 = .05 • Interval Measure = CA / average daily operating costs • 2,256 / ((2,006 + 1,740)/365) = 219.8 days
Computing Long-term Solvency Ratios • Total Debt Ratio = (TA – TE) / TA • (5,394 – 2,556) / 5,394 = 52.61% • Debt/Equity = TD / TE • (5,394 – 2,556) / 2,556 = 1.11 times • Equity Multiplier = TA / TE = 1 + D/E • 1 + 1.11 = 2.11 • Long-term debt ratio = LTD / (LTD + TE) • 843 / (843 + 2,556) = 24.80%
Computing Coverage Ratios • Times Interest Earned = EBIT / Interest • 1,138 / 7 = 162.57 times • Cash Coverage = (EBIT + Depreciation) / Interest • (1,138 + 116) / 7 = 179.14 times
Computing Inventory Ratios • Inventory Turnover = Cost of Goods Sold / Inventory • 2,006 / 301 = 6.66 times • Days’ Sales in Inventory = 365 / Inventory Turnover • 365 / 6.66 = 55 days
Computing Receivables Ratios • Receivables Turnover = Sales / Accounts Receivable • 5,000 / 956 = 5.23 times • Days’ Sales in Receivables = 365 / Receivables Turnover • 365 / 5.23 = 70 days
Computing Total Asset Turnover • Total Asset Turnover = Sales / Total Assets • 5,000 / 5,394 = .93 • It is not unusual for TAT < 1, especially if a firm has a large amount of fixed assets • NWC Turnover = Sales / NWC • 5,000 / (2,256 – 1,995) = 19.16 times • Fixed Asset Turnover = Sales / NFA • 5,000 / 3,138 = 1.59 times
Computing Profitability Measures • Profit Margin = Net Income / Sales • 689 / 5,000 = 13.78% • Return on Assets (ROA) = Net Income / Total Assets • 689 / 5,394 = 12.77% • Return on Equity (ROE) = Net Income / Total Equity • 689 / 2,556 = 26.96%
Computing Market Value Measures • Market Price = $87.65 per share • Shares outstanding = 190.9 million • PE Ratio = Price per share / Earnings per share • 87.65 / 3.61 = 24.28 times • Market-to-book ratio = market value per share / book value per share • 87.65 / (2,556 / 190.9) = 6.55 times
Deriving the DuPont Identity • ROE = NI / TE • Multiply by 1 (TA/TA) and then rearrange • ROE = (NI / TE) (TA / TA) • ROE = (NI / TA) (TA / TE) = ROA * EM • Multiply by 1 (Sales/Sales) again and then rearrange • ROE = (NI / TA) (TA / TE) (Sales / Sales) • ROE = (NI / Sales) (Sales / TA) (TA / TE) • ROE = PM * TAT * EM