Download
1 / 20
200 likes | 472 Views
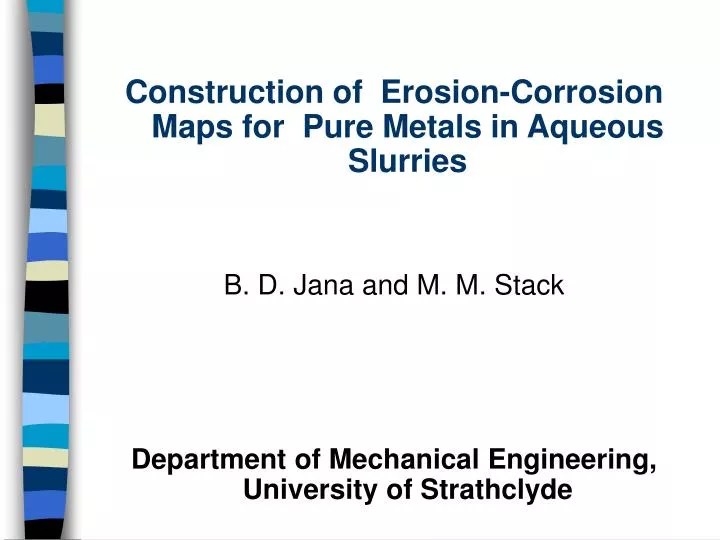
Construction of Erosion-Corrosion Maps for Pure Metals in Aqueous Slurries B. D. Jana and M. M. Stack Department of Mechanical Engineering, University of Strathclyde. Objectives:. Developing mathematical equation for erosion- corrosion problem

E N D
Construction of Erosion-Corrosion Maps for Pure Metals in Aqueous Slurries B. D. Jana and M. M. Stack Department of Mechanical Engineering, University of Strathclyde
Objectives: • Developing mathematical equation for erosion- corrosion problem • Developing a performance relationship between all the variables and parameters of erosion-corrosion in aqueous slurries in a map form • Easy way of representing such graphs
Erosion Corrosion Phenomena Particle Particle Corrosion film Substrate Substrate
Available Erosion Models at Normal Impact • Sundararajan and Shewmon: • Hutchings:
Available Corrosion Models • Activation controlled kinetics (-Butler Volmer Equation) • Passivation controlled kinetics (-repassivation rate due to particle impact)
Erosion-corrosion Work • “… combine wastage due to aqueous corrosion and mechanical erosion process…” • “…the total wastage can be significantly higher than the sum of the two processes…”
Erosion-corrosion Rate • KC is the additive effect, and refers to the erosion enhancement of the corrosion rate. KE is the synergistic effect and refer to the influence of corrosion on the erosion rate
Active Region For simplification, we neglect the additive effect and synergistic effect . So KC and KE is zero
Passive Region • In the passive region KCO is neglected, only additive effect is considered
Regime Map Boundaries Erosion dominated KC/KE 0.1 Erosion corrosion 0.1 KC/KE 1 corrosion erosion 1 KC/KE 10 corrosion dominated KC/KE 10
Pourbaix Diagram for All the Metals. Cu Fe Al Ni
Maps of All the Metals for Ph 7 Fe Ni Cu Al
Wastage Map Boundary LOW KE-C 1 MEDIUM 1 KE-C 10 HIGH KE-C 10
Fe Ni Cu Al Wastage Map for All the Metals for Ph 7
Conclusions • There is a significant difference between the regime and wastage map for all the metals. • The variation above is attributed to the differences in tribo-corrosion behaviour . • Al suffers high erosion corrosion due its less hardness than the other metals • Due to its high immunity, Cu suffers less erosion-corrosion than the other materials, under the conditions modelled.