Download
1 / 29
290 likes | 626 Views
Andrew Muller & Eugene Khokhlov. Collision Warning Design To Mitigate Driver Distraction (CHI 2004). John D. Lee Ph.D. Elizabeth Hayes Daimler Chrysler (Chewbacca). University of Iowa. Joshua D. Hoffman Grad Student. To The Point:.

E N D
Andrew Muller & Eugene Khokhlov Collision Warning DesignTo Mitigate Driver Distraction (CHI 2004) Collision Warning Design
John D. Lee Ph.D. Elizabeth Hayes Daimler Chrysler (Chewbacca) University of Iowa • Joshua D. Hoffman Grad Student Collision Warning Design
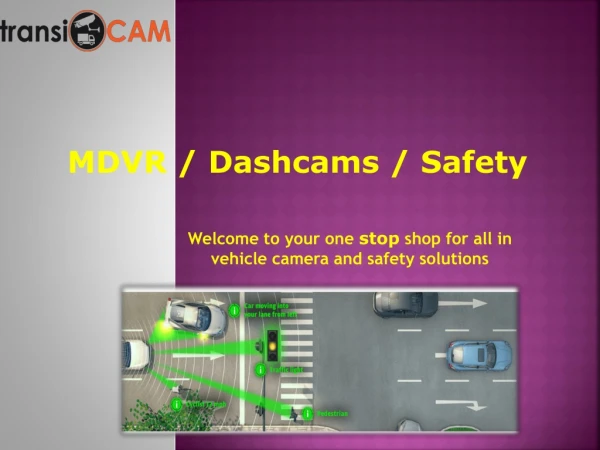
To The Point: • The Problem: Too many distractions while driving a car • The Need: Collision warning system Collision Warning Design
Background Information • In-vehicle Information Systems (IVIS) are now feasible because: • Technology Advances • Societal Trends • IVIS Functionality • Response Types • Critical Factors for IVIS Collision Warning Design
Alert Strategies • Warning Strategies • Graded • Single Staged • Sensor Modality Presentation • Haptic (touch) • Auditory Collision Warning Design
Experiment Goals • Experiment 1 • Examine how driver response depends on graded and single stage warnings • Examine how driver response depends on modality (haptic vs. auditory) of the warning • Experiment 2 • Examine how these warning strategies and modalities affect driver preference Collision Warning Design
Experiment 1 Method • A mixed between/within-subject experimental design • 3, 15-minute driving scenarios • 21 braking events (7x3)=21 • 3 levels of severity • Speech-based email system to distract the driver Collision Warning Design
Participants • 40 individuals • 20 female, 20 male • Ages of 25 and 55 (licensed) • Unaware of the nature of the research • Paid $20 each Collision Warning Design
Apparatus • Fixed-based, medium-fidelity driving simulator • 1992 Mercury Sable • 50-degree visual field of view • 640x480 screen • Visual collision warning icon • Needed elements for auditory and haptic alerts Collision Warning Design
DriveSafety (Hyperion) Collision Warning Design
Experimental Design and Independent Variables • Mixed between-within subject design • Between subject variables • Warning modality • Warning strategy • Within subject variables • Severity of lead vehicle breaking • If response was require Collision Warning Design
Dependent Variables • Safety benefit • Number of collisions • Adjusted minimum time to collision (AMTTC) • Driver response process (response followed by assessment or assessment followed by response) Collision Warning Design
Procedure • Operation instruction • Introductory drive (5 min) • 3 main drives (15 min/each) • 7 braking events per drive @ 55mph • 1/7 was severe, always at end • Complete auditory email task Collision Warning Design
Results • 741 data points total • Repeated-measures ANOVA was used to analyze the data using two-tailed hypothesis tests Collision Warning Design
Results – Severity of braking events and driver response • Drivers responded to braking events in a systematic and realistic manner • AMTTC reflected braking severity • Severity of lead vehicle braking affected drivers’ braking response • Severity of braking affected mean deceleration Collision Warning Design
Results – Interface characteristics and safety benefit (collisions) • 40 potential collisions • 10 collisions occurred • 7 in single-stage and 3 in graded • X2(1)= 2.13, p=0.144 • 5 in auditory and 5 in haptic Collision Warning Design
Results – Interface characteristics and safety benefit (AMTTC) • Slight benefit for graded compared to single-stage • F(1,36)=8.74, p=0.0055 • Graded substantially better in severe braking events Collision Warning Design
AMTTC Collision Warning Design
Response to nuisance alarm braking events Collision Warning Design
Experiment 2 Method • A within-subject experimental design • 4, 10-minute scenarios • 24 braking events • 3 levels of severity • 2/3 of events required no driver response Collision Warning Design
Participants • 20 individuals • 11 females, 9 males (licensed) • Between the ages of 25 and 55 • Unaware of the nature of the research • Paid $20 each Collision Warning Design
Apparatus & Independent variables and experimental design • Same as in experiment 1 Collision Warning Design
Dependent variables • Driver attitudes were measured with a series of subjective rating scales after each drive • After completion of all trials, they comparatively ranked the systems Collision Warning Design
Procedure • Operation instruction • Introductory drive (5 min) • 4 main drives (10 min/each) • 6 braking events per drive • Each scenario had an equal number of event severity Collision Warning Design
Results • Rank the warning modalities in order from 1 to 4 based on preference • Violation of assumption of a repeated measures ANOVA • Applied Friedman’s non-parametric analysis • Only when Friedman’s showed a significant difference between conditions was a post-hoc multiple comparison performed using Fisher’s least significant difference method Collision Warning Design
Conclusions • Graded warning provided a greater safety margin • Graded warning induced fewer inappropriate responses to the nuisance alarms • Graded warning was more trusted • Warning modality had little effect on performance in severe braking events • Haptic warnings were preferred on several dimensions to auditory Collision Warning Design
Questions • In table 2, graded haptic beats single-stage haptic in everything except overall preference, what can account for this? • Does the data on table 2 match what you would have expected? • Graded is preferred for a one hour experiment, how about 5-10 years on daily basis? Collision Warning Design
Questions • Haptic is preferred over auditory in this study, is this a property of auditory or a property of the time span of the test, or some other factor? • Why express haptic through a seat and not a gas pedal as in previous studies? Collision Warning Design