Download
1 / 45
450 likes | 594 Views
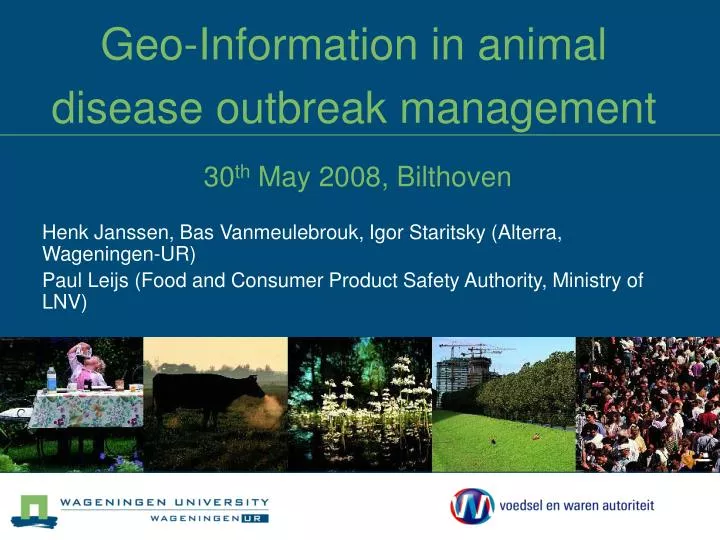
Geo-Information in animal disease outbreak management 30 th May 2008, Bilthoven. Henk Janssen, Bas Vanmeulebrouk, Igor Staritsky (Alterra, Wageningen-UR) Paul Leijs (Food and Consumer Product Safety Authority, Ministry of LNV). Presentation setup. Introduction

E N D
Geo-Information in animal disease outbreak management 30th May 2008, Bilthoven Henk Janssen, Bas Vanmeulebrouk, Igor Staritsky (Alterra, Wageningen-UR) Paul Leijs (Food and Consumer Product Safety Authority, Ministry of LNV)
Presentation setup • Introduction • Knowledge and modelling system: Riskandi • Dutch GIS-pilots in operational animal disease crisis management
Presentation setup • Introduction • Knowledge and modelling system: Riskandi • Dutch GIS-pilots in operational animal disease crisis management
What is GIS? Geographic Information System GIS is a System of computer software, hardware and data, methods and people to help manipulate, analyze and present information that is tied to a spatial location • Spatial location – a geographic location • Information – visualization of analysis of data • System – linking software, hardware, data • People– a thinking explorer who is the key to the power of GIS
EARLY APPLICATION OF GIS FOR CHOLERA CONTROL IN 19TH CENTURY LONDON Dr. John Snow (1813 -1858) Concentration of cholera cases around pump sites
RISKANDI is a Decision Support System to assess ex ante the effectiveness of spatial strategies to diminish the risks of spread of animal diseases RISK ANimalDIseases:Knowledge system and electronic atlas
RISKandi: Example Risk for transmission in the neighbourhood of an infected farm (CSF): • different intervention strategies • different infectious periods
Different intervention strategies Edo Gies en Hans Baveco (Alterra), Gert-Jan Boender en Gonnie Nodelijk (ASG) • Culling only the infected herds • Culling within a radius around the infected herds (500 m, 1 km, 1.5 km) • Vaccination within a radius around the infected herds(500 m, 1 km, 1.5 km, 2 km)
Infectious period Infection Start infectious period Detection Start culling End culling Control-delay Latent Control-duration Different infectious periods BOP5: Edo Gies en Hans Baveco (Alterra), Gert-Jan Boender en Gonnie Nodelijk (ASG) Three infectious periods: 3, 7 and 9 weeks
When the infection period is 9 weeks culling within a 1-km radius is not enough to prevent a big outbreak
Conclusion: • RISKANDI is usefull to answer ‘what if’ questions • RISKANDI can identify locations having highest risk for spread of CSF • RISKANDI can qualify effects of intervention strategies on the risk of spread of CSF • RISKANDI can quantify average costs of culling (without or after vaccination), vaccination costs or costs due to standstill? (per grid cell of 250-m2, and within a radius)
Operational research questions of VWA(Food and Consumer Product Safety Authority in NL) • VWA needs to maintain quarantine areas • VWA needs timely, correct and complete farm and area information in case of contagious animal disease outbreak • VWA desires online (internet-based) GIS-applications as integrated part of their workflow • Our question: can we prepare adequate datasets and software tools?
Workflow during animal crisis situations • Farm -> suspicious symptoms • Veterinarian or other source • Specialists team (Animal Health Service and VWA) • Clinical inspection • Sampling • Filing • Declaration of suspicion within 3 h Letter of suspicion Positive testing • INFORMATION DEMAND • location of farms • location and number of animals • geographic relations • ACTION ! • Surveillance zone (10km) • Protection zone (3 km) • Culling of infected holding + 1 km zone
Pilot web-GIS-applications for use in contagious animal disease crises for the Dutch Ministry • PIKET (English: Picket but also Picket Officer ) • Application for geographical determination and textual description of quarantine areas (Surveillance zone + Protection zone) • GEMMA (Geographic Event Management and Monitoring Application) • Data-selection tool, based on information from Dutch LPIS (‘BRP’), I&R, GIAB (farm location (x,y on shed level) • Internet based • Time line
Approach • Data: testing of quality of available datasets • Process analysis: embedding GIS in workflow • Application: The proof of the pudding…
Coupling of GIAB and crop parcels 34 % 10 % farm ended • GIAB-2005: • Name Address • x-y • 180.639 loc. • Annual Census -2005: • brs-nr • Name Address • Cattle • Sheep/Goats • Pigs • Poultry • Horses • Crops • AHS-2005: • unique farm • locator (ubn) • NAW • Cattle • Sheep/Goats • Pigs 44 % 12 % • Ubn-Brs • ubn-nr • brs-nr 92 % 77 % • LPIS • brs-nr (unique) • Name Adress • Crop • x-y 64 %
Visualizedataquality Light green = arable crops
Conclusion: • VWA/LNV have all relevant data • Data quality is good • GIS helps to show ‘what we don’t know’
Conclusion: • GIS can be used to automate the process of describing quarantine areas
Workflow: Data selection tool Active layers selectable by placing a ‘tick’, the ‘i’ makes the data of the geo-objects ‘identifiable’ Identify to show details Map layers are served using ArcIMS (ESRI)
Creation of a new suspicion New suspicionby selecting a agricultural holding Pan and zoom in the map (standard functionality) New suspicion by selecting a location on the map Circles with adjustable radius
Selection and presentation of farms Foot and Mouth-suspicion Initial suspician Different sub-selects (based on defined circles) Farm with parcels within the circles
Interactive drawing of boundaries Digitizing tools Time line tool Second suspicion Digitized area with a name
Presentation of the timeline of suspicions Deleting a suspicion Tool to release a certain suspicion Store suspicions Retrieve suspicions from the database ‘Free’ holdings in green Timeline selector ‘Free’ holding restricted by second suspicion
Details of a holding Inspection tool (for details of the farm) Data from I&R and Annual Census Parcels of the selected holding Holding 221449 in Google Maps Holding 221449
Reports A printable map (PDF) All holdings in Excell Holding 221449
Concluding remarks • Work flow can be supported with GIS • Challenge: operational integration of data, GIS-tools and end user process • Kostunrix metaphore • It is all about data quality Data needs to be: • Complete, • Timely, • Correct • Available