Download

1 / 43
430 likes | 541 Views
Energy Update! Review Last Lecture 6 Radiation, Conduction, Convection Today’s Material: Lecture 7 Heat Engines Fossil Fuels Homework #2. 99 Percent Of New Power Generation Added In January Came From Renewable Energy.

E N D
Energy Update! • Review Last Lecture 6 • Radiation, Conduction, Convection • Today’s Material: Lecture 7 • Heat Engines • Fossil Fuels • Homework #2
99 Percent Of New Power Generation Added In January Came From Renewable Energy http://thinkprogress.org/climate/2014/02/21/3317221/99-percent-power-renewable/ • More than 99 percent of new electric capacity added in the U.S. in January came from renewable energy sources, according to data released by the Federal Energy Regulatory Commission (FERC) on Thursday. • Of the 325 megawatts of new capacity installed, solar led the way with 287 megawatts added in January. That was followed by geothermal power with three new units totaling 30 megawatts, one new unit of wind energy with an installed capacity of 4 megawatts, and three new units of biomass totaling 3 megawatts. In addition, there was 1 megawatt added that FERC defined as “other.” • Despite significant gains, renewables are still a relatively small piece of the overall capacity picture in America. Renewable sources, including hydro, account for just over 16 percent of total installed operating generating capacity, according to FERC — a picture dominated by fossil fuels. http://www.ferc.gov/legal/staff-reports/2014/jan-infrastructure.pdf
The combined global land and ocean average temperature during January 2014 was 0.65°C (1.17°F) above the 20th century average. This was the warmest January since 2007 and the fourth highest since records began in 1880. This marks the ninth consecutive month (since May 2013) with a global monthly temperature among the 10 highest for its respective month. The Northern Hemisphere land and ocean surface temperature during January 2014 was also the warmest since 2007 and the fourth warmest since records began in 1880 at 0.75°C (1.35°F) above average. http://www.ncdc.noaa.gov/sotc/global/2014/1
http://www.climate-leaders.org/climate-change-resources/climate-change/causes-of-climate-changehttp://www.climate-leaders.org/climate-change-resources/climate-change/causes-of-climate-change Factors that result from climate change and that can then amplify the causes of climate change are known as “positive feedbacks.” Some of the key positive feedbacks include thawing of permafrost (resulting in the release of previously trapped methane), forest loss due to drought (resulting in the release of carbon sequestrated in the wood) and the melting of the polar ice-caps (resulting in a reduced capacity to reflect solar energy from the earth’s surface)
Sunlight that strikes a surface at an angle is spread over a larger area than sunlight that strikes the surface directly. Oblique sun rays deliver less energy (are less intense) to a surface than direct sun rays.
The average annual incoming solar radiation (yellow line) absorbed by the earth and the atmosphere along with the average annual infrared radiation (red line) emitted by the earth and the atmosphere.
The idealized wind and surface-pressure distribution over a uniformly water-covered rotating earth. http://www.youtube.com/watch?v=Ye45DGkqUkE
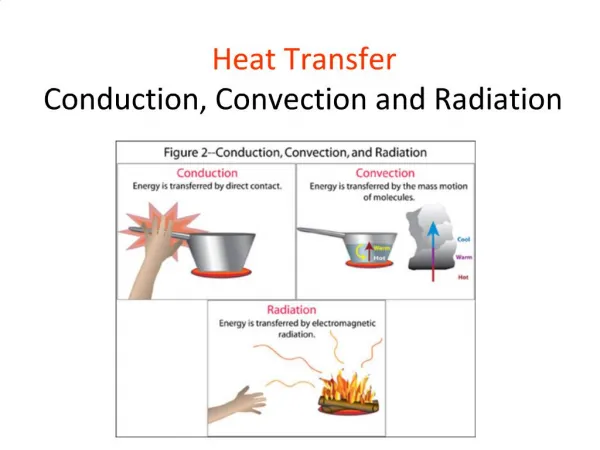
The transfer of heat from the hot end of the metal pin to the cool end by molecular contact is called conduction. The rising of hot air and the sinking of cool air sets up a convective circulation. Normally, the vertical part of the circulation is called convection, whereas the horizontal part is called wind. Near the surface the wind is advecting smoke from one region to another.
Conductive heat flow H through a slab of material with conductivity k: H = (k*A*dT)/d H = (A*dT)/R
An irreversible process (a) A block slides along a surface, gradually slowing. Friction converts the kinetic energy of its directed motion to random thermal energy of its molecules, indicated by the higher temperature when it comes to rest (b). The reverse process, from (b) to (a), is so highly improbable that it’s essentially impossible.
Water can exist in 3 phases, depending upon pressure and temperature. http://www.sci.uidaho.edu/scripter/geog100/lect/05-atmos-water-wx/ch5-part-2-water-phases.htm http://chemwiki.ucdavis.edu/Physical_Chemistry/Physical_Properties_of_Matter/Phase_Transitions/Phase_Diagrams_1
Latent Heat of Vaporization = 600 calories / 1g Latent Heat of Condensation = 600 calories / 1g Latent Heat of Fusion= 80 calories / 1g How much energy to sublimate? http://www2.chemistry.msu.edu/courses/cem152/snl_cem152_SS12/pracprob/practiceexam1.html
http://getsciencehelp.wordpress.com/category/uncategorized/page/4/http://getsciencehelp.wordpress.com/category/uncategorized/page/4/
A real engine converts only some of the extracted heat into work; the rest is rejected to the cool environment. The impossible case of an ideal engine, which extracts heat from a hot substance and delivers an equal amount of mechanical work or electricity.
Diagram of a typical fossil-fueled power plant. Fossil fuels are depleted at a rate that is 100,000 times faster than they are formed. What does this mean? What do you think will happen to the supply of fossil fuels within our lifetime?
Thermodynamic losses and friction leave only about 15 percent of the fuel energy available at the wheels, all of which is dissipated by air resistance, tire friction, and braking. The power needed for accessories runs the air conditioning, lights, audio system, and vehicle electronics.
Approximately 30,000 lives are cut short in the U.S. each year due to pollution from electricity production. What kind of pollution have you seen from electricity and energy production? Diagram of a combined-cycle power plant. The steam section is similar to the one illustrated in Figure 5.9, although details of the cooling and exhaust systems aren’t shown. Hot gas from the gas turbine replaces burning fuel in the steam boiler.
Formation of an oil deposit in a geological structure called an anticline, in which rock layers have bent upward. The oil originally forms in the source rock, then migrates upward through the porous layer to collect at the top, where it is trapped by the overlying impermeable rock. Natural gas may collect above the oil. http://earththeoperatorsmanual.com/segment/3
Simplified diagram of the fractional distillation process used in oil refining, showing temperatures at which different products condense out of the distillation column.
World fossil fuel consumption since 1950. The height of each shaded area represents the amount for one of the three fuels, so the top curve is the total fossil fuel consumption. Thus the graph shows that, in the final year plotted, fossil fuels equivalent to more than 10 gigatonnesof oil (Gtoe) were consumed globally.
Carbon dioxide emission per gigajoule of energy released in the combustion of the three fossil fuels. Natural gas produces just over half the CO2 of coal, making it a more climate-friendly fuel.
World coal reserves in gigatonnes(billions of metric tons).The full height of each bar gives the total coal reserves for the indicated continent, while the lower part shows reserves for the listed country, which has the most coal in that continent.
http://www.mapsofworld.com/business/industries/coal-energy/world-coal-deposits.htmlhttp://www.mapsofworld.com/business/industries/coal-energy/world-coal-deposits.html
http://www.eia.gov/todayinenergy/detail.cfm?id=4390 Source: U.S. Energy Information Administration, International Energy Statistics. Note: With about 15 million short tons in total consumption, the Middle East was by far the smallest coal-consuming region and was too small to show on the map. In the animation, the line chart at the bottom shows the annual production of coal by region in billion short tons.
http://theallaroundoilman.blogspot.com/2010/10/oil-and-gas-map-of-texas.htmlhttp://theallaroundoilman.blogspot.com/2010/10/oil-and-gas-map-of-texas.html
U.S. oil imports have risen substantially to compensate for declining domestic production. The two large drops are the result of oil supply disruptions, price increases, and economic recessions, including the Great Recession of 2008–2010. Have these trends continued?
http://www.washingtonpost.com/blogs/wonkblog/wp/2013/01/09/u-s-oil-imports-are-falling-to-their-lowest-level-since-1987/http://www.washingtonpost.com/blogs/wonkblog/wp/2013/01/09/u-s-oil-imports-are-falling-to-their-lowest-level-since-1987/ U.S. oil imports are falling to their lowest level since 1987 Brad Plumer http://blogs.cfr.org/levi/2013/01/09/how-far-have-u-s-oil-imports-fallen/
An idealized bell-shaped curve for oil production known as Hubbert’s peak. Production peaks when half the resource has been exhausted; thereafter, the production rate declines as the remaining oil reserves become more difficult and expensive to extract
http://en.wikipedia.org/wiki/Peak_oil Peak oil, an event based on M. King Hubbert's theory, is the point in time when the maximum rate of petroleum extraction is reached, after which the rate of production is expected to enter terminal decline. Choosing a particular curve determines a point of maximum production based on discovery rates, production rates and cumulative production. Early in the curve (pre-peak), the production rate increases because of the discovery rate and the addition of infrastructure. Late in the curve (post-peak), production declines because of resource depletion. http://en.wikipedia.org/wiki/Hubbert_peak_theory
Peak oil scenarios graph, depicting cumulative published by the Association for the Study of Peak Oil and Gas and others, comparing various prediction models. http://en.wikipedia.org/wiki/File:PU200611_Fig1.png
http://www.spiegel.de/international/spiegel/the-coming-conflict-natural-resources-are-fuelling-a-new-cold-war-a-429968.htmlhttp://www.spiegel.de/international/spiegel/the-coming-conflict-natural-resources-are-fuelling-a-new-cold-war-a-429968.html
Class Review: • Fossil Fuels: • Coal • Gas • Oil • Next Class • Nuclear Energy