
Evaluate the Graph
E N D
Presentation Transcript
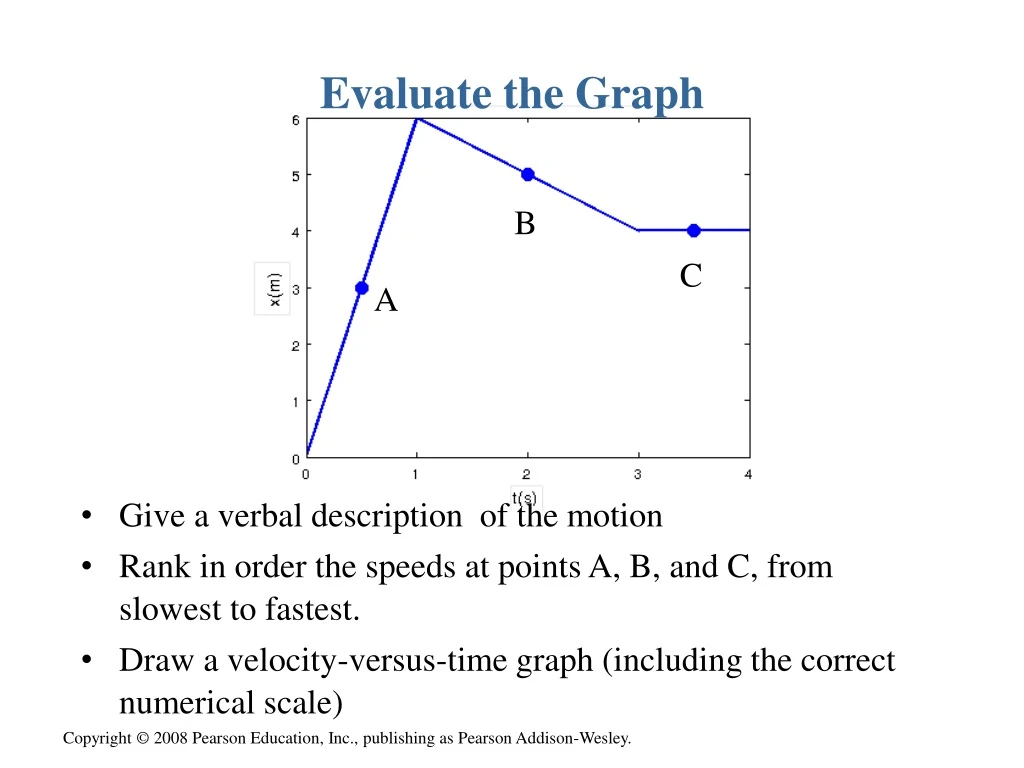
Evaluate the Graph B C A • Give a verbal description of the motion • Rank in order the speeds at points A, B, and C, from slowest to fastest. • Draw a velocity-versus-time graph (including the correct numerical scale)
Evaluate Graphs B A A B • For each graph, answer the following question. • Do A and B ever have the same speed? If so, at what time or times?
Motion Activity • Use a motion detector with the LoggerQuest • Motion Activity - One member of each group walks • at a steady speed away from the motion detector • at a steady speed toward the motion detector • at an increasing speed away from the motion detector • at a decreasing speed away from the motion detector • at an increasing speed toward the motion detector • at a decreasing speed toward the motion detector • For each, sketch diagrams, position graphs, and velocity graphs • To change time, switch modes so that the choices are File and Sensor, then select Data Collection
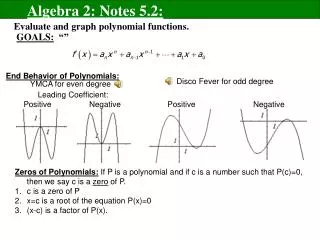
Finding Position from Velocity If we know the initial position, si, and the instantaneous velocity, vs, as a function of time, t, then the final position is given by Or, graphically;
Back and Forth position position velocity velocity acceleration acceleration derivative slope integral area area derivative integral slope
Find Area Graphically • Using the graph, find the position at t = 1, 2, 3, 4, and 5 s and make a table. • From this data, draw a position-versus-time graph
Find Area Graphically • A train is moving at a steady 30 m/s. At t = 0s, the engine passes a single light at x = 0 m. Without using any formulas, find the engine’s position at t = 1 s, t = 2 s and t = 3 s. • Graph position and velocity versus time • Find the area from the velocity-versus-time graph • Δs = area under the velocity-versus-time graph
Position-Versus-Time • Trucker Bob starts the day 120 miles west of Denver. He drives east for 3 hours at a steady 60 miles/hour before stopping for his coffee break. • Draw a position-versus-time graph for Bob, including appropriate numerical scales along both axes. • Let Denver be located at x = 0 and assume that the x-axis points to the east.
Uniform Motion Straight-line motion in which equal displacements occur during any successive equal-time intervals is called uniform motion. For one-dimensional motion, average velocity is given by Notice the symbol Δ. It represents a displacement and an interval in time - not position or instant in time
Problem Solving Strategy • Sally opens her parachute at an altitude of 1500 m. She then descends slowly to earth at a steady speed of 5 m/s. How long does it take her to touch down? • Draw pictorial representation – coordinates, symbols • Motion diagram • Mathematical Representation • Are results reasonable?
Upcoming Assignments • Pre-class MasteringPhysics assignment due before class on Thursday • MasteringPhysics online HW due Thursday by 11 pm