
Exploring Linear Functions in Graphs
E N D
Presentation Transcript
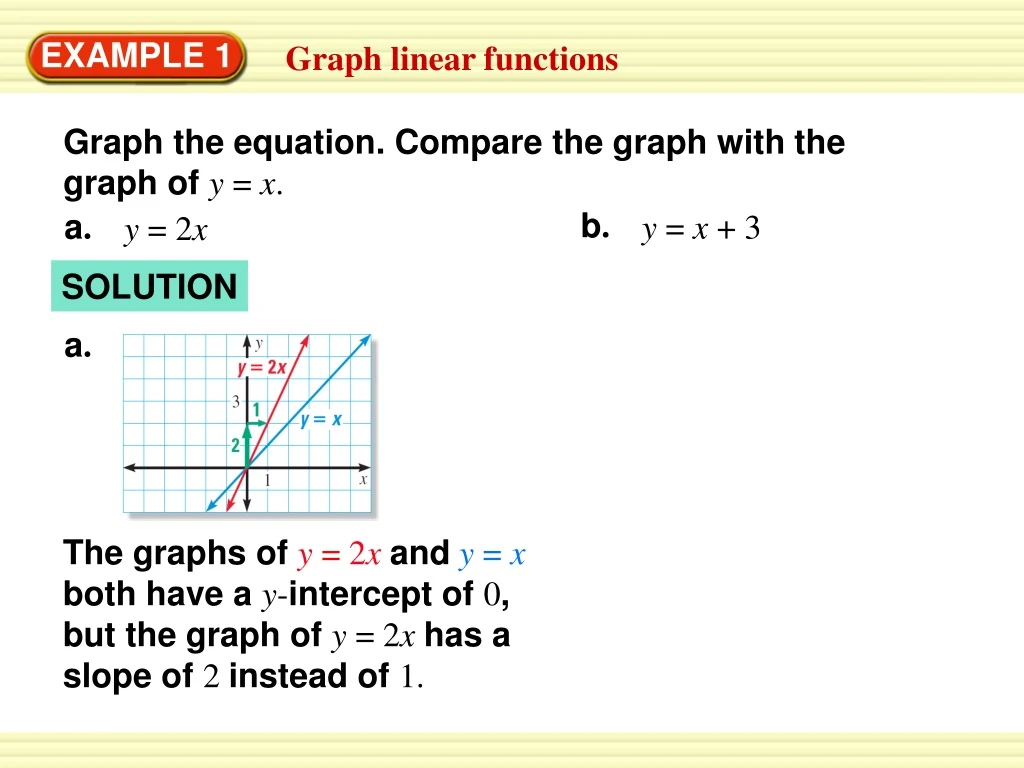
b. a. y = x + 3 y = 2x a. EXAMPLE 1 Graph linear functions Graph the equation. Compare the graph with the graph of y = x. SOLUTION The graphs ofy = 2x andy = x both have a y-intercept of 0, but the graph ofy = 2x has a slope of2 instead of 1.
b. EXAMPLE 1 Graph linear functions The graphs ofy = x + 3 and y = x both have a slope of 1, but the graph ofy = x + 3has a y-intercept of 3 instead of 0.
Graph y = –x – 1. 2 3 EXAMPLE 2 Graph an equation in slope-intercept form SOLUTION STEP 1 The equation is already in slope-intercept form. STEP 2 Identify the y-intercept. The y-intercept is – 1, so plot the point (0, – 1) where the line crosses the y-axis.
2 3 – 2 Identify the slope. The slope is –, or , so plot a second point on the line by starting at (0, – 1) and then moving down 2 units and right 3 units. The second point is (3, – 3). 3 EXAMPLE 2 Graph an equation in slope-intercept form STEP 3
EXAMPLE 2 Graph an equation in slope-intercept form STEP 4 Draw a line through the two points.
1. y = –2x for Examples 1 and 2 GUIDED PRACTICE Graph the equation. Compare the graph with the graph of y = x. SOLUTION The graphs ofy =–2x andy = x both have a y-intercept of 0, but the graph ofy = –2x has a slope of–2instead of 1.
2. y = x – 2 for Examples 1 and 2 GUIDED PRACTICE Graph the equation. Compare the graph with the graph of y = x. SOLUTION The graphs ofy = x – 2 and y = x both have a slope of 1, but the graph ofy = x – 2has a y-intercept of –2instead of 0.
3. y = 4x for Examples 1 and 2 GUIDED PRACTICE Graph the equation. Compare the graph with the graph of y = x. SOLUTION The graphs ofy = 4x andy = x both have a y-intercept of 0, but the graph ofy = 4x has a slope of4 instead of 1.
for Examples 1 and 2 GUIDED PRACTICE Graph the equation 4. y = – x + 2 SOLUTION STEP 1 The equation is already in slope-intercept form. STEP 2 Identify the y-intercept. The y-intercept is +2, so plot the point (0, +2) where the line crosses the y-axis.
for Examples 1 and 2 GUIDED PRACTICE STEP 3 Identify the slope. The slope is –1 so plot a second point on the line by starting at (0, 2) and then moving down 1 unit and right 1 unit. The second point is (1, 1). STEP 4 Draw a line through the two points.
2 5 5. y = x + 4 for Examples 1 and 2 GUIDED PRACTICE Graph the equation SOLUTION STEP 1 The equation is already in slope-intercept form. STEP 2 Identify the y-intercept. The y-intercept is +4, so plot the point (0, +4) where the line crosses the y-axis.
2 5 Identify the slope. The slope is so plot a second point on the line by starting at (0, 4) and then moving up 2 unit and right 5 unit. The second point is (5, 6). for Examples 1 and 2 GUIDED PRACTICE STEP 3 STEP 4 Draw a line through the two points.
1 2 6. y = x – 3 for Examples 1 and 2 GUIDED PRACTICE Graph the equation SOLUTION STEP 1 The equation is already in slope-intercept form. STEP 2 Identify the y-intercept. The y-intercept is –3, so plot the point (0, –3) where the line crosses the y-axis.
1 2 Identify the slope. The slope is so plot a second point on the line by starting at (0, –3) and then moving up 1 unit and right 2 unit. The second point is (–2 , 2). for Examples 1 and 2 GUIDED PRACTICE STEP 3 STEP 4 Draw a line through the two points.
for Examples 1 and 2 GUIDED PRACTICE Graph the equation 7. y = 5 + x SOLUTION STEP 1 The equation is already in slope-intercept form. STEP 2 Identify the y-intercept. The y-intercept is +5, so plot the point (0, +5) where the line crosses the y-axis.
for Examples 1 and 2 GUIDED PRACTICE STEP 3 Identify the slope. The slope is 1 so plot a second point on the line by starting at (0, 5) and then moving up 1 unit and right 1 unit. The second point is (1, 6). STEP 4 Draw a line through the two points.
for Examples 1 and 2 GUIDED PRACTICE Graph the equation 8. f (x) = 1 – 3x SOLUTION STEP 1 The equation is already in slope-intercept form. STEP 2 Identify the y-intercept. The y-intercept is +1, so plot the point (0, +1) where the line crosses the y-axis.
for Examples 1 and 2 GUIDED PRACTICE STEP 3 Identify the slope. The slope is –3 so plot a second point on the line by starting at (0, 1) and then moving down 3 unit and right 1 unit. The second point is (1, 2). STEP 4 Draw a line through the two points.
for Examples 1 and 2 GUIDED PRACTICE Graph the equation 9. f (x) = 10 – x SOLUTION STEP 1 The equation is already in slope-intercept form. STEP 2 Identify the y-intercept. The y-intercept is +10, so plot the point (0, +10) where the line crosses the y-axis.
for Examples 1 and 2 GUIDED PRACTICE STEP 3 Identify the slope. The slope is –1 so plot a second point on the line by starting at (0, 10) and then moving down 1 unit and right 1 unit. The second point is (1, 9). STEP 4 Draw a line through the two points.