Download
1 / 26
260 likes | 291 Views
e-Science and Technology Infrastructure for Biodiversity and Ecosystem Research. Biodiversity. Species (organisms and their populations) >10 7 species; species with 10 2 to 10 12 individuals. Genes and DNA 10 6 to 10 9 nucleotides in a DNA molecule. Ecosystems

E N D
e-Science and Technology Infrastructurefor Biodiversity and Ecosystem Research
Biodiversity Species (organisms and their populations) >107 species; species with 102 to 1012 individuals Genes and DNA 106 to 109 nucleotides in a DNA molecule Ecosystems habitats with 104 to 106 species, and manyfold interactions
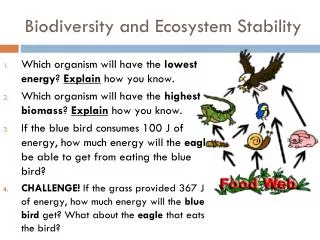
Estimated number of species X 1000 Mostly insects ?
The big questions in biodiversity research Ecosystems Time and evolution Species DNA, proteins and genes Scale
Which actions to ensure long-term sustainability How to manage multi-functional land/sea-scapes Where are the thresholds in ecosystem structures and functions ? Can we adapt to environmental change What are the impacts of changes in climate, pollution and land/sea-use on biodiversity How do changes affect the provision of ecosystem services
The biodiversity system is complex and cannot be described by the simple sum of its components and relations Experimentation on a few parameters is not enough: Limitations to scaling up results for understanding system properties LifeWatch adds a new technology to support the generation and analysis of large-scale data-sets on the biodiversity system. Find patterns and learn processes.
This defines an infrastructure with • distributed observatories/sensors, • interoperable databases, • computational capability, • and computational capacity. • A single portal for researchers, • policy makers, industries and public at large • Find data and model to analyse statistical relationships • Accelerate data capture with new technologies • Structure the scientific community • with new opportunities for large-scale projects
LifeWatch: an Analytical Platform • supports research on biodiversity and ecosystem functioning from the gene up to the landscape level • drives frontier science through fast and new technologies • combines science and policy perspectives
Year 2013 Increasing worries about the effects of climate change on the invasion of pest insects. A researcher has an innovative plan to model the possible effects on food crops. This requires data sets from all over Eurasia and lots of computational capacity. Year 2014 Our researcher builds a LifeWatch virtual work space and attracts dozens of collaborators inventing additional functions. Data providers also jump in. Year 2015 Donors are starting a campaign for a funding programme. The researcher receives an important prize.
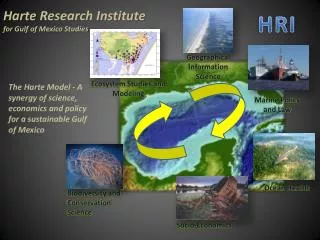
Crucial resources Ecosystems Analysis & modelling Species Interoperability Genes Observatories data functions
Architecture • Collaboration • Common Exploratory Environment • Collaborative Virtual Organisations Users Semantic metadata framework and workflow development Composition Analysis and processing • Integration of resources • Documented, shared workflows • Grid computation E-Infrastructure Data• measurements, observations & sensors • other infrastructures Statistical software Distributed computing power Resources
Users The LifeWatch research infrastructure Composition E-Infrastructure Resources
LifeWatch and GBIF: serving each other Users LifeWatch supports its users to share their data through GBIF Composition E-Infrastructure GBIF provides access to data (web services) Resources GBIF
LifeWatch Highway for analyses and use Applications Models GBIF Data sharing on species, specimens and observations Analytical tools Data access & interoperability Data / resource providers
Phylogenomics & Biogeography GeospatialServices Operations Services Base Services Thematic Services Services and Tools Catalogue Taxonomy &Systematics Annotations repository General Services Species Richness & Ecosystem Services Provenance/citation repository Biodiversity Valuation Semantic Mediation Framework Computational Resources Species DistributionDynamics Workflow management Genes-Species-Specimens(multi-scale linkages) Portal Server(s) Virtual Collaborative Environments Citizen Science &Observations Some examples of data, modelling and analysis capabilities
Benefits and user groups Basic research Molecular biology Population biology Systematics Ecosystem research Systems biology Computation Economy Applied sciences Nature conservation & management Agriculture Fisheries Epidemiology Pharmacy Biotechnology Other communities EEA, Ministries and national agencies Engineering comp. Oil & mining industry Insurance Military Information Tech
LifeWatch as a distributed research infrastructure Distributed independent entities, but crucial for LifeWatch operations Distributed entities “owned” by LifeWatch
Data networks LifeWatch Applications Analysis/ Modelling Data integration Data management Data generation (digitizing; sampling; sensoring LTER network and marine stations Collection and observation networks
The assumed Life Watch life cycle 1995 2005 2008 2011 2014 Earlier projects Conception Preparations Construction Operation & Evolution Critical ! 2008 2009 2010 Political commitment initial decision final decision Construction ‘blue print’ logistics construction
Preferred phase transition Construction Phase Activities Preparatory Phase Time
The Life Watch Preparatory Phase A Policy & Science Board oversees the project Networks of Excellence Countries Coord. Management Preparatory project Risk & Quality Control Publicity & PR Strategy Legal organisation Financial plan Construction policy Service plan
Partnership in the preparatory project Scientific networks Contracted participants Countries Executive participants Other partners Status as per November 2009 19 countries: letter of support for the preparations Up to now, 11 countries selected LifeWatch for their national Road Map 7 of these will start consultations and negotiations Also interest from other continents Data networks International infrastructures User sectors Industry
2012 Target time line 1st Operational services 2011 Additional countries join the LifeWatch ERIC New LifeWatch organisation in place Signatory event with Ministers 1st meeting Governing Board End of the Preparatory Project 2010 EC approves the Statutes Early start of start-up organisation for the Construction Phase Go/no-go for the Construction Critical mass to start early Constructions Submission of ERIC Statutes Stakeholders Board meets Master Plan in the public Governance Project