Download
1 / 16
160 likes | 179 Views
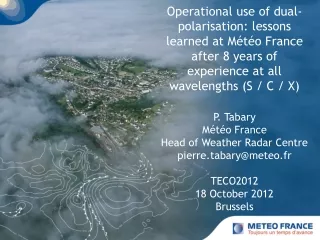
Operational use of dual-polarisation: lessons learned at Météo France after 8 years of experience at all wavelengths (S / C / X) P. Tabary Météo France Head of Weather Radar Centre pierre.tabary@meteo.fr TECO2012 18 October 2012 Brussels. Outline of the presentation.

E N D
Operational use of dual-polarisation: lessons learned at Météo France after 8 years of experience at all wavelengths (S / C / X)P. Tabary Météo France Head of Weather Radar Centre pierre.tabary@meteo.fr TECO2012 18 October 2012 Brussels
Outline of the presentation • The French metropolitan radar network • Demonstrated benefits of polarimetry at X / C / S bands • Challenges / Open issues
The French metropolitan radar network in 2012 DP DP DP DP DP DP In 1991 : 11 radars DP DP In 2012 • 26 radars • All Doppler (Triple-PRT) • 18 C band (13 DPOL) • 6 S band (2 DPOL) • 2 X band (2 DPOL) DP DP DP DP DP DP : DPOL Radar Purple = S Green = C Brown = X
Polarimetry Roadmap 2004 - 2014 • 2004: First C-band dual-pol radar installed in Trappes • 2004 – 2008: Demonstration of the benefits for: • Non Precipitation Echo ID • Attenuation Correction • Self-consistency calibration • Rainfall rate retrieval • Hydrometeor Classification • 2012: 1ST version of DPOL processing chain operational • Non Precipitation Echo ID • Basic DP-based Attenuation Correction • 2014 (plan): 2ND version of DPOL processing chain operational • Hydrometeor ID (Rain, Hail, Wet Snow, Dry Snow, …) • Improved Rain Rate Estimation : Hybrid “Z-KDP” estimator • Data Quality • Calibration • Monitoring
Automatic Non Precipitation Echo ID HV Texture of ZDR Histograms of dual-polarisation variables (HV and texture of ZDR) in precipitation, ground-clutter and clear-air. no precipitation Gourley, JJ, P. Tabary, J. Parent-du-Chatelet, 2007: A fuzzy logic algorithm for the separation of precipitating from non-precipitating echoes using polarimetric radar, J. Atmos. Oceanic Technol. Vol. 24, No. 8, 1439–1451.
Automatic Non Precipitation Echo ID 200 km Green = clear air Blue = ground-clutter Reflectivity (dBZ) Echo Type Yellow = Precipitation Gourley, JJ, P. Tabary, J. Parent-du-Chatelet, 2007: A fuzzy logic algorithm for the separation of precipitating from non-precipitating echoes using polarimetric radar, J. Atmos. Oceanic Technol. Vol. 24, No. 8, 1439–1451.
Quantitative Precipitation Estimation • Evaluation at hourly time step against rain gauges in rain • Comparison restricted to within 60 km of the radar • Evaluation at the 3 wavelengths : X / C / S • Comparison of 3 different rain rate estimators • QPE algorithm is adapted from Tabary (2007) and includes : VPR and beam blocking correction, advection correction, …. • No real-time gauge adjustment is applied “radar only” QPE Tabary P. 2007. The New French Operational Radar Rainfall Product. Part I: Methodology. Wea. Forecasting. 22: 393-408.
Results at S-band - Summer 2010 - 1 radar - 4 EventsEvaluation at hourly time step against rain gauges RR NB corr ≥5.0 -0.27 0.82 RR NB corr ≥5.0 -0.18 0.84 RR NB corr ≥5.0 -0.09 0.88 • “Z-KDP” • If KDP < 1°/km Use of Z-R (Marshall-Palmer) with attenuation correction • If KDP > 1°/km Use of R(KDP) Z-R (Marshall-Palmer) without attenuation correction Z-R (Marshall-Palmer) with attenuation correction PIA (dB) = 0.04 * DP (°) RR = Hourly Rain Gauge Accumulation (in mm) NB = Normalized Bias (Radar vs. Gauge) Corr = Correlation coefficient
Results at C-band - Summer 2010 - 4 radars - 26 EventsEvaluation at hourly time step against rain gauges DBP2 No RGAdj RR NB corr ≥5.0 -0.47 0.54 RR NB corr ≥5.0 -0.34 0.70 RR NB corr ≥5.0 -0.19 0.79 • “Z-KDP” • If KDP < 1°/km Use of Z-R (Marshall-Palmer) with attenuation correction • If KDP > 1°/km Use of R(KDP) Z-R (Marshall-Palmer) without attenuation correction Z-R (Marshall-Palmer) with attenuation correction PIA (dB) = 0.08 * DP (°) RR = Hourly Rain Gauge Accumulation (in mm) NB = Normalized Bias (Radar vs. Gauge) Corr = Correlation coefficient
Results at X-band – 2011 - 1 radar - 4 EventsEvaluation at hourly time step against rain gauges RR NB corr ≥5.0 -0.74 0.52 RR NB corr ≥5.0 -0.51 0.63 RR NB corr ≥5.0 -0.28 0.70 • “Z-KDP” • If KDP < 0,5°/km Use of Z-R (Marshall-Palmer) with attenuation correction • If KDP > 0,5°/km Use of R(KDP) Z-R (Marshall-Palmer) without attenuation correction Z-R (Marshall-Palmer) with attenuation correction PIA (dB) = 0.28 * DP (°) RR = Hourly Rain Gauge Accumulation (in mm) NB = Normalized Bias (Radar vs. Gauge) Corr = Correlation coefficient
Data Quality: Polarimetric monitoring indicators 12 • If well calibrated / processed (DP & ZDR), polarimetric variables improve the quality of all conventional radar products; • If not well calibrated / processed, polarimetric variables may lower the quality of all conventional radar products; Examples : 1) Large biases on ZDR may strongly impact rain rate estimation (0.2 dB ~ 15%) 2) Remaining ground-clutter may corrupt entire range profiles because of errors in DP offset computation • Need to have very robust calibration, monitoing & correction procedures
Long-term monitoring of polarimetric indicatorsBlaisy (C-band) – August 2010 April 2011 ZDR for ZH=20-22 dBZ 12 & 13-10-2010 Maintenance on the radar Typical scatter ~ 0.3 dB(Required: 0.2 dB) 28-03 & 01-03-2011 Maintenance on the radar DP offset Slight positive bias (+0.2 dB) HV 9 months ZDR at 90°
Long-term monitoring of polarimetric indicatorsBlaisy Stability of ZDR is close to – but still slightly below - requirements (0.3 dB vs. 0.2 dB required) Temperature & electronic calibration procedures are thought to be responsible for the observed scatter Work under progress … The quantitative use of ZDR remains a challenge … ZDR for ZH=20-22 dBZ 12 & 13-10-2010 Maintenance on the radar Typical scatter ~ 0.3 dB(Required: 0.2 dB) 28-03 & 01-03-2011 Maintenance on the radar DP offset Slight positive bias (+0.2 dB) HV 9 months ZDR at 90°
Conclusions 15 • Polarimetry has become the new standard in operational radar networks • Polarimetry improves the quality of all radar products (e.g. rain rate estimation) especially at high frequency (X) • New products can be proposed with polarimetry (e.g. hydrometeor classification) • Phase-based parameters (DP and KDP) are very valuable for attenuation correction and rain rate estimation • The quantitative use of ZDR is still a challenge (calibration / stability issues vs. 0.2 dB precision required) • The benefits for Quantitative Precipitation Estimation have been demonstrated in rain. Solid precipitation estimation is still an open area of research • Rain gauges are still needed !