Download

1 / 15
160 likes | 440 Views
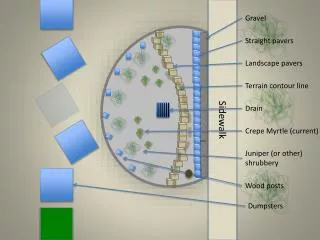
Sidewalk and Bus Stop Design. Presented by: Dan Feinblum 5/9/01 ENCE 667. Project Overview. Consultants Working For Delaware Department of Transportation (DelDOT) Work in Churchmans Crossing Area 3-5 Years for All Design and Construction Design New Sidewalks and Bus Stops

E N D
Sidewalk and Bus Stop Design Presented by: Dan Feinblum 5/9/01 ENCE 667
Project Overview • Consultants Working For Delaware Department of Transportation (DelDOT) • Work in Churchmans Crossing Area • 3-5 Years for All Design and Construction • Design New Sidewalks and Bus Stops • Improve Existing Conditions
Project Objectives • Improve Pedestrian Mobility • Promote a Multi-modal Transportation System • Improve Traffic Conditions • Complete and Connect Existing Networks • Improve Drainage • Satisfy Americans With Disabilities Act (ADA)
Performance Measures • Critical Path Method (CPM) • Project Crashing • Subcritical Path Analysis • Lead-Lag (Precedence) Relationships
Develop Base Schedule • Determine Activities and Their Characteristics • Create Activity on Arrow Diagram • Complete Forward and Backward Pass • Input into Primavera Scheduling Software • Determine Critical Path and Overall Project Duration
Critical Path of Base Schedule • Activities on Critical Path: 10, 20, 110, 270, 130, 120, 280, 290, 220, 200, 240, 300, 230, 320, 210, and 250 • Verified Project Duration of 256 Days and Critical Path in Linear Program
Network Diagram for Base Schedule 180 11 80 4 5 START 200 70 100 17 18 120 10 20 110 13 14 1 2 3 10 220 240 130 280 270 290 300 170 190 12 15 16 19 20 40 50 160 6 24 230 30 60 25 260 310 7 8 21 90 9 320 22 250 23 END
Project Crashing • Modified Linear Program of Base Schedule • Allowed for 11 Activities to be Crashed • Could Not Crash an Activity To Less Than 1 Day • Used Linear Programming to Generate Cost VS. Project Duration Graph • Minimum Duration of Project = 57 Days
Cost VS. Project Duration • 220 Days Costs $5600 • 210 Days Costs $7225 Difference = $1625
Subcritical Path • 20% of Activities Generate 80% of Delays • Paerto (1848-1923) Analysis • Quantifies the Criticality of All Project Paths • Utilizes the Following Equations: 1 = the minimum total slack (or lag) in a network 2 = the maximum total slack in the network = total slack for the path whose criticality is to be calculated.
Subcritical Path Analysis * Path 1 includes the following activities : 320, 300, 290, 280, 270,250, 240, 230,220, 210, 200, 20, 130, 120, 110, 10
Lead- Lag (Precedence) Relationships • Utilizes CPM • Shortens Project Duration by Allowing Activities to be Completed Simultaneously • Implement Where Activities Could be Completed Simultaneously • Shortened Project Duration from 256 to 224 Days (Saves 32 Days) Example :Activity 110 can begin 5 days after activity 20 starts. Allows adequate time for initial SW & BS locations to be developed so that Right of Way can begin working
Future Work • More Detailed Version of Schedule • Implement Multi-Project Scheduling • Resource Allocation • Probability Analysis of Activity/Project Durations Any Questions?