Introduction
10 likes | 80 Views
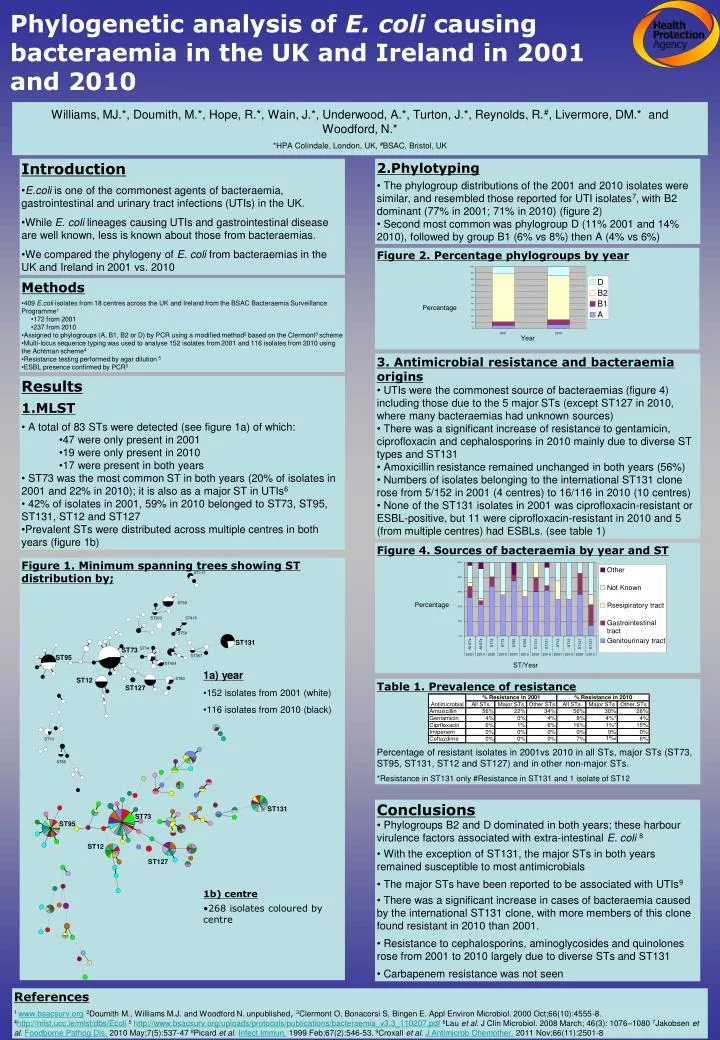
Phylogenetic analysis comparing E. coli strains causing bacteraemia in UK and Ireland in 2001 and 2010, highlighting phylogroup distributions, antimicrobial resistance patterns, and prevalent sequence types.

Introduction
E N D
Presentation Transcript
Figure 1. Minimum spanning trees showing ST distribution by; ST117 ST69 ST393 ST415 ST59 ST131 ST73 ST14 ST95 ST357 ST404 • 1a) year • 152 isolates from 2001 (white) • 116 isolates from 2010 (black) ST12 ST80 ST127 ST10 ST88 ST131 ST73 ST95 ST12 ST127 • 1b) centre • 268 isolates coloured by centre Phylogenetic analysis of E. coli causing bacteraemia in the UK and Ireland in 2001 and 2010 Williams, MJ.*, Doumith, M.*, Hope, R.*, Wain, J.*, Underwood, A.*, Turton, J.*, Reynolds, R.#, Livermore, DM.* and Woodford, N.* *HPA Colindale, London, UK, #BSAC, Bristol, UK • Introduction • E.coli is one of the commonest agents of bacteraemia, gastrointestinal and urinary tract infections (UTIs) in the UK. • While E. coli lineages causing UTIs and gastrointestinal disease are well known, less is known about those from bacteraemias. • We compared the phylogeny of E. coli from bacteraemias in the UK and Ireland in 2001 vs. 2010 • 2.Phylotyping • The phylogroup distributions of the 2001 and 2010 isolates were similar, and resembled those reported for UTI isolates7, with B2 dominant (77% in 2001; 71% in 2010) (figure 2) • Second most common was phylogroup D (11% 2001 and 14% 2010), followed by group B1 (6% vs 8%) then A (4% vs 6%) Figure 2. Percentage phylogroups by year • Methods • 409 E.coli isolates from 18 centres across the UK and Ireland from the BSAC Bacteraemia Surveillance Programme1 • 172 from 2001 • 237 from 2010 • Assigned to phylogroups (A, B1, B2 or D) by PCR using a modified method2 based on the Clermont3 scheme • Multi-locus sequence typing was used to analyse 152 isolates from 2001 and 116 isolates from 2010 using the Achtman scheme4 • Resistance testing performed by agar dilution 5 • ESBL presence confirmed by PCR5 Percentage Year • 3. Antimicrobial resistance and bacteraemia origins • UTIs were the commonest source of bacteraemias (figure 4) including those due to the 5 major STs (except ST127 in 2010, where many bacteraemias had unknown sources) • There was a significant increase of resistance to gentamicin, ciprofloxacin and cephalosporins in 2010 mainly due to diverse ST types and ST131 • Amoxicillin resistance remained unchanged in both years (56%) • Numbers of isolates belonging to the international ST131 clone rose from 5/152 in 2001 (4 centres) to 16/116 in 2010 (10 centres) • None of the ST131 isolates in 2001 was ciprofloxacin-resistant or ESBL-positive, but 11 were ciprofloxacin-resistant in 2010 and 5 (from multiple centres) had ESBLs. (see table 1) • Results • 1.MLST • A total of 83 STs were detected (see figure 1a) of which: • 47 were only present in 2001 • 19 were only present in 2010 • 17 were present in both years • ST73 was the most common ST in both years (20% of isolates in 2001 and 22% in 2010); it is also as a major ST in UTIs6 • 42% of isolates in 2001, 59% in 2010 belonged to ST73, ST95, ST131, ST12 and ST127 • Prevalent STs were distributed across multiple centres in both years (figure 1b) Figure 4. Sources of bacteraemia by year and ST Percentage ST/Year Table 1. Prevalence of resistance Percentage of resistant isolates in 2001vs 2010 in all STs, major STs (ST73, ST95, ST131, ST12 and ST127) and in other non-major STs. *Resistance in ST131 only #Resistance in ST131 and 1 isolate of ST12 • Conclusions • Phylogroups B2 and D dominated in both years; these harbour virulence factors associated with extra-intestinal E. coli 8 • With the exception of ST131, the major STs in both years remained susceptible to most antimicrobials • The major STs have been reported to be associated with UTIs9 • There was a significant increase in cases of bacteraemia caused by the international ST131 clone, with more members of this clone found resistant in 2010 than 2001. • Resistance to cephalosporins, aminoglycosides and quinolones rose from 2001 to 2010 largely due to diverse STs and ST131 • Carbapenem resistance was not seen References 1 www.bsacsurv.org2Doumith M., Williams M.J. and Woodford N. unpublished, 3Clermont O, Bonacorsi S, Bingen E. Appl Environ Microbiol. 2000 Oct;66(10):4555-8. 4http://mlst.ucc.ie/mlst/dbs/Ecoli5http://www.bsacsurv.org/uploads/protocols/publications/bacteraemia_v3.3_110207.pdf6Lau et al. J Clin Microbiol. 2008 March; 46(3): 1076–1080 7Jakobsen et al. Foodborne Pathog Dis. 2010 May;7(5):537-47 8Picard et al. Infect Immun. 1999 Feb;67(2):546-53. 9Croxall et al. J Antimicrob Chemother. 2011 Nov;66(11):2501-8


