Download
1 / 19
190 likes | 362 Views
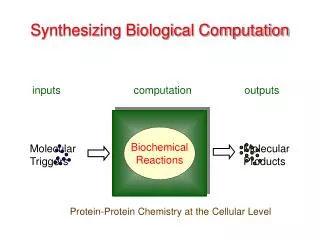
Sensitivity analysis on the biochemical reactions that affect mercury fish concentrations. A modeling approach . Representation of mercury cycle in E-MCM. Parthavi Pathak. Table of contents. Introduction Objective Approach Sensitivity Analysis Outlook. Bacteria. Hg (II) . MeHg.

E N D
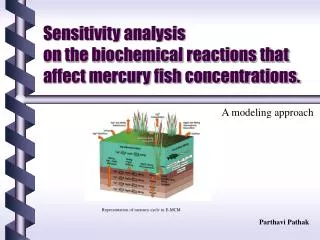
Sensitivity analysis on the biochemical reactions that affect mercury fish concentrations. A modeling approach Representation of mercury cycle in E-MCM Parthavi Pathak
Table of contents • Introduction • Objective • Approach • Sensitivity Analysis • Outlook
Bacteria Hg (II) MeHg HgS (s) Mercury Cycle in Sediment According to current version of the model • Sulfate reducing bacteria are the major biological contributors of methyl mercury formation in sediments.
SRB mediate the formation of sulfide as a result of respiration processes that require sulfate (SO42-) as a terminal electron acceptor Loss of methylmercury from pore waters occurs as a result of demethylation • Studies conclude that inhibition of MeHg formation occurs in high sulfate environment. • Process involved are Methylation and De-methylation
Objective • To make use of E-MCM model (prepared by Tetra Tech Inc) for Sunday lake. • To evaluate most important biochemical factors affecting fish mercury concentrations. • To determine which of the kinetic parameters of the biochemical reactions most significantly affect mercury transformation.
Approach • All analysis has been done using generic data set. • Picked mercury in fish as target for keeping it as dependent variable. Bacterial methylation: Bacterial methylation occurs in active zone of sulfate reducers. • It depends on quantity of accessible HgII in pore water or surface water, and the activity of methylating microbes. • Methylation entails supply of carbon. • To estimate activity of SRB carbon decomposition rate and limiting factor (carbon/sulfate) must be known. • The overall decomposition rate has two components: decomposition of DOC and POC
Effect of sulfate on methylation reaction M = Cdecomp* Efficiency * Sulfate Effect * [HgIIavail] * Area * Porosity where: • M = methylation rate, ug HgII day-1 • Cdecomp = g carbon decomposed per day per m2 sediment (for the sediment layer being modeled) • Sulfate Effect = {1 + ((X * SO4supply) * (SO4supply+ KSO4,supply)-1)} (dimensionless) • X = Factor to relate the efficiency with which microbes methylate • SO4supply = Sulfate concentration (eq L-1) • KSO4supply = Half saturation constant for sulfate effect (eq L-1)
Efficiency = methylating efficiency of microbes • [HgIIavail] = concentration of dissolved HgII in water or pore water which is available for methylation (ug HgII m-3) • Area = sediment area (m2) • Porosity = porosity of sediments Hg Rate Constant Input Values in E-MCM for methylation: • Methyl Switch • Methylating Efficiency of microbes • Half saturation constant • Maximum Sulfate effect System specific Hg Rate Constant Input Values: • Depth of methylation zone in sediments • Base temperature at which methylation rate is measured • Henry’s law constant for MeHg
Methyl Switch This input is a switch which selects which HgII complexes are available for methylation
Methylating Efficiency of microbes Methylating efficiency of microbes, per unit of carbon flux and unit available HgII concentration.(g MeHg/g TOC labile )
Half Saturation Constant for sulfate Concentration (KS04) This value is used in the estimation of microbial methylation rates. Set KSO4 to zero to remove any sulfate effect on methylation. Lower Limit >=0; Upper Limit NA
Depth of methylation zone in sediments • Methylation begins in the sediments at the anaerobic threshold and only occurs where the sediments are assumed to be saturated. Lower Limit >=0; Upper Limit NA • The model gives no change in graphs by changing the depth values.
Bacterial de-methylation: • A bacterial process powered by methyl mercury availability and activity of de-methylating microbes. • The product of bacterial de-methylation is assumed to be elemental mercury • Similar to methylation, carbon decomposition rate and limiting factor must be known
De-methylation Reaction: D = Cdecomp * Efficiencyd * [MeHgavail] * Area *Porosity where: • D = De-methylation rate, ug HgII day-1 • Cdecomp = g carbon decomposed per day per m2 sediment (for the sediment layer being modeled) • Efficiency = De-methylating efficiency of microbes • [MeHgavail] = concentration of dissolved MeHg in water or pore water which is available for de-methylation (ug HgII m-3) • Area = sediment area (m2) • Porosity = porosity of sediments
Hg Rate Constant Input Values in E-MCM for methylation: • De-methyl Switch • De-methylating Efficiency of microbes
De-methyl Switch This input is a switch which selects which HgII complexes are available for de methylation.
Demethylating efficiency of microbes • Demethylating efficiency of microbes, per unit of carbon flux and unit available MeHg concentration. • Demethylation does not depend on temperature in this version of the model. • Lower Limit >=0; Upper Limit NA (g ElemHg/g TOC lab )
Summary • Kinetic parameters, representing principal mechanisms for mercury speciation and transport, are major targets for the sensitivity analysis. • The efficiency of microbes is the most sensitive variable. • Methyl or de-methyl switch: What mercury complexes are we missing? Future work: • Use the model for Sunday lake calibrated data. • Identify the most dependent kinetic variable for fish mercury concentration.