Download
1 / 22
220 likes | 358 Views
California Water Issues. AGST 3000 Agriculture, Society and the Natural World www.water-ed.org/cabriefing.asp www.dwr.water.ca.gov/. Look at the those websites and…. From the first site, read…”A Briefing on California Water Issues”

E N D
California Water Issues AGST 3000 Agriculture, Society and the Natural World www.water-ed.org/cabriefing.asp www.dwr.water.ca.gov/
Look at the those websites and… From the first site, read…”A Briefing on California Water Issues” Search the second sight and provide details on the Central Valley Project: • Who is the Central Valley Project operated by? • How many reservoirs are part of the CVP and how many acre feet do they hold and are delivered in an average year? • In contrast, How many reservoirs are part of the State • Water Project and how many acre feet do they hold and are delivered in an average year? • How many farmed acres does the CVP irrigate? • How many people does the CVP provide drinking water for? • In contrast, what percentage does the SWP deliver to urban vs. agriculture?
Water Terminology Acre-feet An acre-foot equals the amount of water needed to cover an acre of land to the depth of one foot (326,000) and is approximately the amount of water used by an average family of four during two year period. Overdraft The deficit between pumped water from a groundwater basin and the long-term recharge.
California’s Tug of Water Geologic Tugs Geologic Tug #1: The North 75%– 25% South precipitation distribution circumstance Geologic Tug #2: The Coast Range and Sierra Nevada Mountains rain shadow effects Geologic Tug #3: The Drought/Flood cycles Geologic Tug #4: Calif. is the number 1 ground water using state, but has little regulation
California’s Tug of Water Water Use Tugs Water Use Tug #1: 80% of water demand occurs south of Sacramento North versus South Water Use Tug #2: There is also an East versus West use conflict Water Use Tug #3: Water demand is highest in the summer when availability is lowest Water Use Tug #4: Environmentalists idea on water use versus water developers ideas Water Use Tug #5: Agriculture versus Urban use: who gets how much and when, etc.? Water Use Tug #6: What are the water rights for various interest groups in the future?
Figure 1. Freshwater Consumption as a Percentage of Local Average Annual Precipitation. (Source: USDA-NRCS, 2001)
California’s Water Supply California’s ground water • California’s groundwater basins store about 850 million acre-feet of water. (Less than 50% is unavailable for use due to depth of water table.) • Groundwater cannot be removed that will not be replenished. • 15 million acre-feet of groundwater is pumped each year. • 20% of the state’s water requirements are met with pumped groundwater. • CA is operating on a 1.3 million acre-foot overdraft. • CA groundwater is recharged by: • 1) Nature – rain & snow (7 million acre-foot annually) • 2) After usage – agriculture & industry (6.65 million acre-feet annually) • 3) Recharge programs
California’s surface water • Comes from an average annual statewide precipitation of almost 24 inches. (Ranging from almost nothing in the deserts to more than 100 inches in the northern mountains) • Sixty percent of the precipitation is evaporated or transpired by trees and vegetation. The remaining forty percent equals about 71 million acre-feet of stream flow. • Colorado River flows diverted to California supply 4.8 million acre-feet.
California’s surface water continued… • Inflow streams from Oregon add an addition 1.4 million acre-feet. • This means in an average year California has available slightly more than 78 million acre-feet of water. • However, not all of this water can be collected for use (almost 29 million acre-feet occurs in the north coast region alone and much of it is unavailable for use).
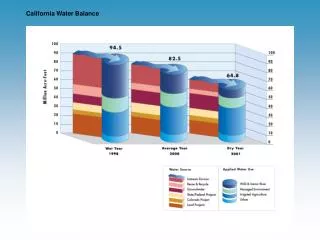
Agriculture is the largest user of CA water supply. • 80% of developed supply • 28-35 million acre-feet depending on yearly rainfall • Irrigated acres 2002-8,709,353 1997-8,886,693 • Irrigated acreage is declining due to urban growth • A large percentage of agriculture water percolates back into ground or streams (around 5 million acre-feet contributes to re-charge)
CA urban use is about 7.8 million acre-feet. • One acre of houses uses approximately the same amount of water as an acre of agriculture crops • 26 million acre-feet is diverted to environmental uses during normal years less in drought years) • 9.56 million acre-feet for the Delta • 17.8 for wild and scenic river flows • This amount is expected to increase
Regional water use: • Central Valley 19 million acre-feet • Sacramento River 11.7 million acre-feet • South Coast 4.6 million acre-feet • Colorado River 4 million acre-feet
The earth’s water supply… • Salt Water 97.2% • Fresh Water 2.8% • Ground Water 0.6% • Lakes and Streams 0.01% • Glaciers and Icecaps 2.2% • Water Vapor 0.001%
Chronology of Water in California • Refer to the handout Class Discussion…after reviewing the handout, in your opinion… • What are some of the most significant events? • What is the most striking aspect of the entire list of events?
WATER RESOURCE PROBLEMS Too Much Water… • Untimely precipitation: India gets 90% of its rainfall from June-Sept. – Monsoon Season results in: • Floods • Water logged soils • Leaches soil nutrients • Soil erosion
Figure 2. Excessive Erosion on Cropland, 1997. Each red dot represents 5000 acres of highly erodible land and each yellow dot represents 5000 acres of non-highly erodible (USDA-NRCS2001)
Floods are also beneficial… • Provide nutrients to farmland located in the flood plain • Recharge groundwater • Refill wetlands • Keep waterways flooding during droughts • Provide fish and wildlife habitat
Floodplains… a magnet for human settlement • Fertile soil • Close to water for domestic and agricultural uses and as source of transportation • Usually a flat area suitable for farming, buildings, highways, railroads, etc.. • But, these areas are referred to as floodplains for a reason • Floods kill many people annually and are responsible for billions of $ in property damage
Too Little Fresh Water… • Droughts • Most damaging natural hazard • Since 70’s, 24,000 people/yr. killed • 40% of world’s pop. live in 80 arid/semiarid countries
At risk areas include… • N. Africa, parts of India, N. China, Middle East, Mexico, parts of W. U.S., & much of former U.S.S.R. • Potential causes • Deforestation • Overgrazing • Desertification • Natural vegetation replacement • Impact of global warming • Water will be a foreign policy issue
Water Issues • Allocating more water for fish and wildlife • Population Growth • Water Conservation • The Bay-Delta • Colorado River • Water Marketing • Groundwater Overdraft and Contamination • Agricultural Drainage • Class Discussion…