Download
1 / 54
540 likes | 558 Views
Errors and uncertainties in chemistry internal assessment. The consideration and appreciation of the significance of the concepts of errors and uncertainties helps to develop skills of inquiry and thinking that are not only relevant to the group 4 experimental sciences

E N D
Errors and uncertainties in chemistry internal assessment • The consideration and appreciation of the significance of the concepts of errors and uncertainties helps to develop skills of inquiry and thinking that are not only relevant to the group 4 experimental sciences • The treatment of errors and uncertainties is directly relevant in the internal assessment criteria of: • data collection and processing, aspects 1 and 3 (recording raw data and presenting processed data) • conclusion and evaluation, aspects 1, 2 and 3 (concluding, evaluating procedure(s), and improving the investigation).
Within internal assessment students should be able to do the following: • make a quantitative record of uncertainty range (±) (data collection and processing: aspect 1) • state the results of calculations to the appropriate number of significant figures. The number of significant figures in any answer should reflect the number of significant figures in the given data (data collection and processing: aspect 3). • propagate uncertainties through a calculation so as to determine the uncertainties in calculated results and to state them as absolute and/or percentage uncertainties.
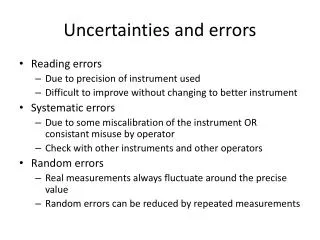
Random and systematic errors • Systematic errors arise from a problem in the experimental set-up that results in the measured values always deviating from the “true” value in the same direction, that is, always higher or always lower. Examples of causes of systematic error are miscalibration of a measuring device or poor insulation in calorimetry experiments.
Random errors arise from the imprecision of measurements and can lead to readings being above or below the “true” value. Random errors can be reduced with the use of more precise measuring equipment or its effect minimized through repeat measurements so that the random errors cancel out.
Uncertainties in raw data • When numerical data is collected, values cannot be determined exactly, regardless of the nature of the scale or the instrument. If the mass of an object is determined with a digital balance reading to 0.1 g, the actual value lies in a range above and below the reading. This range is the uncertainty of the measurement. If the same object is measured on a balance reading to 0.001 g, the uncertainty is reduced, but it can never be completely eliminated. When recording raw data, estimated uncertainties should be indicated for all measurements.
Uncertainty in Measurements Measurements always involve a comparison. When you say that a table is 6 feet long, you're really saying that the table is six times longer than an object that is 1 foot long. The foot is a unit; you measure the length of the table by comparing it with an object like a yardstick or a tape measure that is a known number of feet long. The comparison always involves some uncertainty. If the tape measure has marks every foot, and the table falls between the sixth and seventh marks, you can be certain that the table is longer than six feet and less than seven feet. To get a better idea of how long the table actually is , though, you will have to read between the scale division marks. This is done by estimating the measurement to the nearest one tenth of the space between scale divisions. Which of the following best describes the length of the beetle's body in the picture to the left? Between 0 and 2 inBetween 1 and 2 inBetween 1.5 and 1.6 inBetween 1.54 and 1.56 inBetween 1.546 and 1.547 in
Uncertainty in Length Measurements • Measurements are often written as a singlenumberrather than a range. The beetle's length in the previous frame was between 1.54 and 1.56 inches long. The single number that best represents the measurement is the center of the range, 1.55 inches. When you write the measurement as a single number, it's understood that the last figure (the 5 in this case) had to be estimated. Consider measuring the length of the same object with two different rulers. • Give the correct length measurement for the steel pellet for each of the rulers, as a single number rather than a range: Left Ruler: ................ in Right Ruler: .............. in
ANSWERS • The left ruler has scale markings every inch, so you must estimate the length of the pellet to the nearest 1/10 of an inch. 1.4 in, 1.5 in, or 1.6 in would be acceptable answers. • The right ruler has scale markings every 0.1 inches, so you must estimate the length of the pellet to the nearest 0.01 inches. 1.46 inches is an acceptable answer.
Uncertainty in Length Measurements • Give the correct length measurement for this electronic component for each of the rulers, as a single number rather than a range: Blue Ruler:................ cm White Ruler:.............. cm The blue ruler has scale markings every 0.1 cm, so you must estimate the length of the electronic component to the nearest 0.01 cm. 1.85 cm, 1.86 cm, or 1.87 cm would be acceptable answers. The white ruler has scale markings every 1 cm, so you must estimate the length of the electronic component to the nearest 0.1 cm. 1.9 cm is an acceptable answer.
Uncertainty in Temperature Measurements • A zero will occur in the last placeof a measurement if the the measured value fell exactly on a scale division. For example, the temperature on the thermometer just should be recorded as 30.0°C. Reporting the temperature as 30°C would imply that the measurement had been taken on a thermometer with scale marks 10°C apart!
Uncertainty in Temperature Measurements • A temperature of 17.00°C was recorded with one of the three thermometers to the left. Which one was it? the top onethe middle onethe bottom oneeither the top one, or the middle oneeither the middle one, or the bottom oneit could have been any of them
ANSWERS • The top thermometer had scale markings 0.1°C apart; it could be read to the nearest 0.01°C. • The middle thermometer has scale markings ever 0.2°C, so it can be read to the nearest 0.02°C. • The bottom thermometer has markings every degree, and can be read to the nearest tenth of a degree. Try again.
Uncertainty in Volume Measurements • Use the bottom of the meniscus (the curved interface between air and liquid) as a point of reference in making measurements of volume in a graduated cylinder, pipet, or buret. In reading any scale, your line of sight should be perpendicular to the scale to avoid 'parallax' reading errors. • The graduated cylinder on the left has scale marks 0.1 mL apart, so it can be read to the nearest 0.01 mL. Reading across the bottom of the meniscus, a reading of 5.72 mL is reasonable (5.73 mL or 5.71 mL are acceptable, too). Enter the volume readings for the middle and right cylinders below, assuming each scale is in mL. • Middle Cylinder Volume:................mL • Right Cylinder Volume:................mL
ANSWERS • The middle cylinder has graduations every mL, and can be read to the nearest 0.1 mL. Since the meniscus touches the mark, the reading should be recorded as 3.0 mL, NOT as 3 mL. If you read 3.1 mL, you were probably reading across the top of the meniscus. Read at the bottom of the meniscus. • The right cylinder has graduations every 0.1 mL, and can be read to the nearest 0.01 mL. Since the meniscus is just below the halfway mark between 0.3 and 0.4, the reading should be recorded as 0.34 mL (although readings of 0.35 mL or 0.33 mL are acceptable). If you read 0.37 or 0.38, you were probably reading across the top of the meniscus. Read at the bottom of the meniscus.
Example 1. If smallest division of a ruler is 1 mm, than uncertainity range is 0.5 mm= 0.05 cm = 0.0005 m If smallest division of graduated cylinder is 5 cm3 , than uncertainity range is 2.5cm3. If smallest division of graduated cylinder is 10 cm3 , than uncertainity range is 5cm3. If smallest division of graduated cylinder is 1 cm3 , than uncertainity range is 0.5cm3. If smallest division of graduated cylinder is 1 mm3 , than uncertainity range is 0.5mm3.
Propagating errors • Random errors (uncertainties) in raw data feed through a calculation to give an error in the final calculated result. There is a range of protocols for propagating errors. A simple protocol is as follows:
When adding or subtracting quantities, then the absolute uncertainties are added. For example, if the initial and final burette readings in a titration each have an uncertainty of ±0.05 cm3 then the propagated uncertainty for the total volume is (±0.05 cm3) + (±0.05 cm3) = (±0.10 cm3).
When multiplying or dividing quantities, then the percent (or fractional) uncertainties are added.
Therefore, calculated moles of NaOH in solution = 1.00×[10.00/1000] = 0.0100 moles (±6%) • The student may convert the calculated total percent uncertainty back into an absolute error or leave it as a percentage.
Exact Numbers • Numbers obtained by counting have no uncertaintyunless the count is very large. For example, the word 'sesquipedalian' has 14 letters. "14 letters" is not a measurement, since that would imply that we were uncertain about the count in the ones place. 14 is an exact number here. • Very large counts often do have some uncertainty in them, because of inherent flaws in the counting process or because the count fluctuates. For example, the number of human beings in the state of Maryland would be considered a measurement because it can not be determined exactly at the present time. • Numbers obtained from definitions have no uncertainty unless they have been rounded off. For example, a foot is exactly 12 inches. The 12 is not uncertain at all. A foot is also exactly 30.48 centimeters from the definition of the centimeter. The 8 in 30.48 is not uncertain at all. But if you say 1 foot is 30.5 centimeters, you've rounded off the definition and the rounded digit is uncertain. • Which of the following quantities can be determined exactly? (Select all that are NOT measurements.) The number of light switches in the room you're sitting in nowThe number of ounces in one poundThe number of stars in the skyThe number of inches per meterThe number of red blood cells in exactly one quart of blood
ANSWERS • Anything that can be easily counted is exact. The number of light switches in the room you're sitting in now is exact, for example.Any defined quantity is exact. The number of ounces in one pound is exactly 16. The number of inches per meter must be exact since there are exactly 30.48 centimeters in a foot, exactly 12 inches in a foot, and exactly 100 centimeters in a meter. • Stars in the sky and red blood cells in a given volume of blood can be counted, but the counts are so large that there will inevitably be some uncertainty in the final result.
Significant Figures • The significant figures of a (measured or calculated) quantity are the meaningful digits in it. There are conventions which you should learn and follow for how to express numbers so as to properly indicate their significant figures
Any digit that is not zero is significant. Thus 549 has three significant figures and 1.892 has four significant figures. • Zeros between non zero digits are significant. Thus 4023 has four significant figures. • Zeros to the left of the first non zero digit are not significant. Thus 0.000034 has only two significant figures. This is more easily seen if it is written as 3.4x10⁻⁵. • For numbers with decimal points, zeros to the right of a non zero digit are significant. Thus 2.00 has three significant figures and 0.050 has two significant figures. For this reason it is important to keep the trailing zeros to indicate the actual number of significant figures.
For numbers without decimal points, trailing zeros may or may not be significant. Thus, 400 indicates only one significant figure. To indicate that the trailing zeros are significant a decimal point must be added. For example, 400. has three significant figures, and 4 x10^2 has one significant figure. • Exact numbers have an infinite number of significant digits. For example, if there are two oranges on a table, then the number of oranges is 2.000... . Defined numbers are also like this. For example, the number of centimeters per inch (2.54) has an infinite number of significant digits, as does the speed of light (299792458 m/s)
There are also specific rules for how to consistently express the uncertainty associated with a number. In general, the last significant figure in any result should be of the same order of magnitude (i.e.. in the same decimal position) as the uncertainty. Also, the uncertainty should be rounded to one or two significant figures. Always work out the uncertainty after finding the number of significant figures for the actual measurement. For example, 9.82 +/- 0.0210.0 +/- 1.54 +/- 1
ANSWERS 1.This measurement had FOUR significant figures. The 2, 3, and 0 are certain; the 1 is uncertain. Significant digits include all of the figures up to and including the first uncertain digit. 2. Since the hundredths place was uncertain, the graduated cylinder must have had markings 0.1 mL apart. 3. The last figure is the uncertain one; writing the number as 23.01 mL means: My best estimate of the volume is 23.01 mL, but it could have been 23.00 mL or maybe 23.02 mL.
ANSWERS 1. This measurement had FIVE significant figures. The 1, 0, 2, and 7 are certain; the 8 is uncertain. Significant digits include all of the figures up to and including the first uncertain digit. 2. Since the ten thousandths place was uncertain, the scale must have had markings 0.001 g (1 mg) apart. 3. The last figure is the uncertain one; writing the number as 1.0278 g means: My best estimate of the volume is 1.0278 g, but it could have been 1.0277 g or maybe 1.0279.
ANSWERS 1. 0.000341 kg = 0.341 g = 341 mg. 341 mg clearly has 3 significant figures, and so must the same measurement written in kg or g. 2. 12 µg = 0.000012 g = 0.000000012 kg. 12 µg clearly has 2 significant figures, and so must the same measurement written in g or kg. 3. 0.01061 Mg = 10.61 kg = 10610 g. 10.61 kg clearly has 4 significant figures, and so must the same measurement written in g or Mg.
Counting Significant Digits A Procedure for Counting Significant Digits • How can you avoid counting zeros that serve merely to locate the decimal point as significant figures? Follow this simple procedure: • Move the decimal point so that it is just to the right of the first nonzero digit, as you would in converting the number to scientific notation. • Any zeros the decimal point moves past are not significant, unless they are sandwiched between two significant digits. • All other figures are taken as significant.
ANSWERSa)0.010010 g has 5 significant figures. The trailing zero is significant; the leading zeros are not. b) 10.00 g has 4 significant figures. The trailing zeros are significant. The decimal point does not move past them when the number is converted to scientific notation. c) 1010010 g has at least 6 significant figures. The trailingzero(s) can not be counted as significant.
ANSWERS a)1010.010 g has 7 significant figures. The trailing zero is right of the decimal point and is significant; the zeros sandwiched between the ones are also significant. b) 0.00302040 g has 6 significant figures. The trailing zero are significant, since it is to the right of the decimal point. The leading zeros are not significant. The zeros that are sandwiched between nonzero digits are significant. c) 101000 g has at least 3 significant figures. The trailing zero(s) can not be counted as significant. d) 32010.0 g has 6 significant figures. The trailing zero is significant because it is to the right of the decimal point; all of the other zeros are sandwiched between two significant figures, so they're significant, too. e) 0.01030 g has 4 significant figures. The trailing zero(s) are significant because they are to the right of the decimal point. Zero(s) that are to the left of the first nonzero digit are NOT significant. f) 100 g has at least 1 significant figures. The trailing zero(s) can not be counted as significant.
Try these • 2.43479 rounded to 3 figures is ........... • b)1.756243 rounded to 4 figures is ........... • 9.973451 rounded to 4 figures is ........... Answers a) 2.43479 should be rounded to 2.43. The fourth figure is a 4, so the number is rounded down. b) 1.756243 should be rounded to 1.756. The fifth figure is a 2, so the number is rounded down. c) 9.973451 should be rounded to 9.973. The fifth figure is a 4, so the number is rounded down.
Counting Significant Digits for a Series of Measurements • Suppose you weigh a penny several times and obtain the following masses. • 2.5019 g2.5023 g2.5030 g2.5037 g2.5043 g2.5009 g • How many significant figures should the average mass be reported to?
Counting Significant Digits for a Series of Measurements • The average can't be more precise than any of the individual measurements. The exact average is 2.5026833333333333333333... g. Clearly this is not an appropriate way to report the average, since it implies more precision than any of the masses being averaged actually have. Masses taken from the balance could be estimated to the nearest tenth of a milligram (0.0001 g) so the average can't be more precise than 2.5027 g. • The last figure is the one and only uncertain figure. Remember the definition of significant figures: all digits up to and including the first uncertain digit. Look at the penny weights above. Which digits are uncertain? The last two places change from measurement to measurement. If we want to write an average so that the last figure recorded is the first (and only) uncertain figure, it's best to write the average as 2.503 g.
Examples of Uncertainty calculations 1) Combining uncertainties in several quantities: adding or subtracting When one adds or subtracts several measurements together, one simply adds together the uncertainties to find the uncertainty in the sum. Ex: Dick and Jane are acrobats. Dick is 186 +/- 2 cm tall, and Jane is 147 +/- 3 cm tall. If Jane stands on top of Dick's head, how far is her head above the ground? Answer: combined height = 186 cm + 147 cm = 333 cm uncertainty in combined height = 2 cm + 3 cm = 5 cm combined height = 333 cm +/- 5 cm