Download
1 / 13
130 likes | 147 Views
This text provides an introduction to statistical analysis and how it works with data sets. It covers topics such as data organization, data management tasks, transforming data, and representing data distributions graphically.

E N D
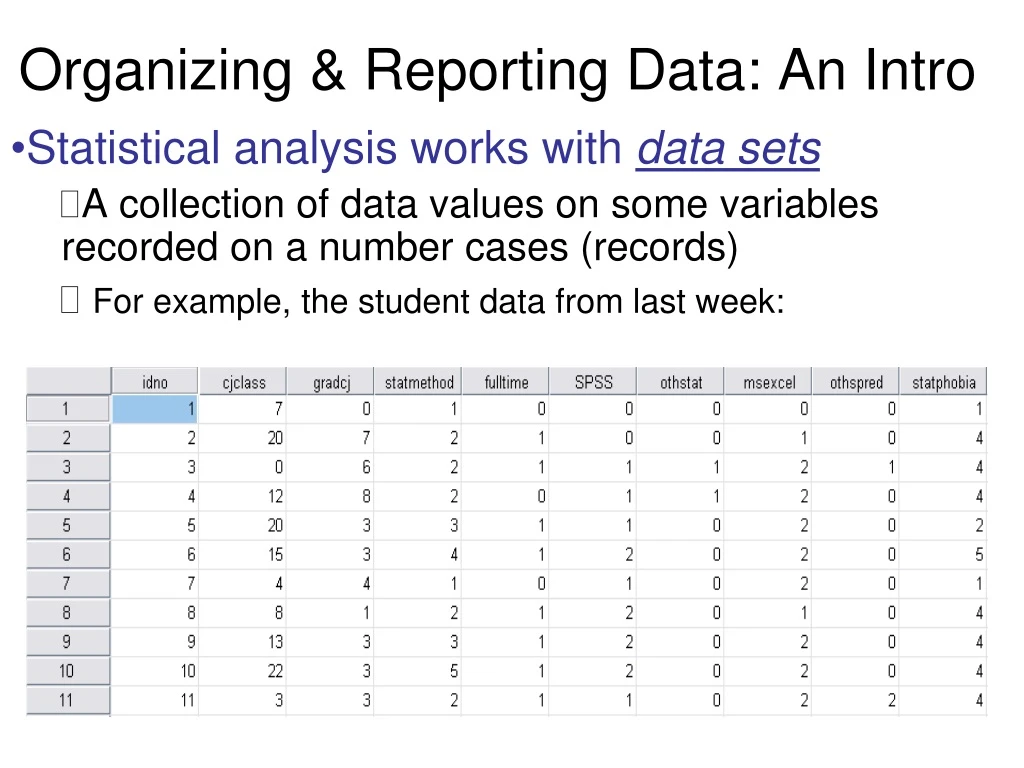
Organizing & Reporting Data: An Intro Statistical analysis works with data sets A collection of data values on some variables recorded on a number cases (records) For example, the student data from last week:
Organizing & Reporting Data (cont.): Structure of most data sets = “rectangular Columns = Variables Rows = Cases Cells = individual values
Managing Data: Basic Tasks NOTE: Reliance on Codebook for Data Set Specify information about variables in the data set Indicate Variable Names & Labels Indicate Variable Values (codes) & Value Labels Indicates “missing values” Can Modify Overall Arrangement of Data Set Sorting Change the order of the cases in the file Selecting identify a subset of cases to work on Transforming modify the values of a variable
Organizing & Reporting Data (cont.): Where do the data values come from? Raw Data: recorded from responses, record, or observations In their (more-or-less) original form Some coding (or editing) operations usually involved Usually coded into numerical values (for ease of use) Transformed Data: modified from original values Computed values (e.g., rates, %, sums, “imputations”) Recoded values (into more correct or meaningful or useful values) Created Data: values are “made up” Simulated values Demonstration values
Managing Data: Basic Tasks Transforming Data: Variable Transformations Computing new variables from prior ones Index = Q1 + Q2 + Q3 + Q4 Utility = probability * outcome Recode Variable by changing its values Change missing values (“blanks”) to “0” Recode Variable into a New Variable Age (yrs) Child (1-11); Juvenile (12-17); Adult (18-over) Age (yrs) 10-19 yrs; 20-29 yrs; 30-39 yrs; 40-49 yrs; 50-59 yrs; 60-69 yrs; 70-79 yrs; 80-89 yrs; 90-99 yrs.
Computed Data: Some Useful forms Rates – numbers divided by populations Ratios – one number divided by another Indexes– new variable = a sum (or other combination) of multiple prior variables Rescaled Data– a raw score modified by some mathematical function (e.g., logarithm) Standardized scores– Rescaled to standard units e.g., Z-scores
Recoded Data: Some Useful forms Collapsed (& abbreviated) scores Grouped scores – recoding a numeric variable into a discrete (numeric or ordinal) variable Uniform (or fixed-width) groupings widths of groups are all the same [Note the standard rules for forming grouped variables] Non-uniform (variable or flexible) groupings widths of groups are not all the same Normed groupings grouped by proportions of cases e.g., percentiles, quartiles, median-splits [a special form of non-uniform grouping]
How to recode variables in SPSS? Use the Transform option on the top menu bar to change the data (see Appendix B in Kirkpatrick/Feeney for details) Compute allows for computing a new variable from prior variables Recode allows for modifying how a variable is coded ‘Into same variables’ (change original variable) ‘Into different variables’ (create new variable with different codes & leave original variable as is)
Representing Data Distributions: In statistics, we are working with a collection of many data points Our focus is on the distribution of the whole set of points Three forms of presentation for summarizing distributions of data points: Tabular tables and lists of numbers Graphical pictures, shapes, and lines (in charts, graphs, and diagrams) Verbal words and phrases
Tabular Presentations: Basic Formats Data Listing: simple inventory of points in the data set Ordered Data Listing: Inventory of data sorted into groups or arranged in increasing or decreasing order Frequency Table:summary showing each value and the number of cases having that value (most relevant for discrete variables) Percentage Table: table with percentages of total cases given rather than (or in addition to) numerical counts Cumulative Percentage Table:reporting percentages of total cases which have that specific value or lower. Cross-Tab Table:a “bivariate” frequency distribution of the values of one variable across the values of another variable
Cross-Tabulations (cont.) What are the parts of a cross-tab? Cells Rows and columns Marginals Grand total How to set up a cross-tab? Which variables are in the rows and columns? Use Percentages or Frequencies? How to percentage a cross-tab?
Representing Distributions Graphically: Basic Formats • Pie Charts • Bar Charts • Vertical or Horizontal • Simple or Grouped • Stacked • Histograms • Line Charts • Frequency polygons • Time (Trend) plots • Relationship plots
Representing Distributions Graphically: Basic Formats • Other Charts ( to be dealt with later): • Box Plots (aka “Box-and-Whiskers”) • Scatter Plots