Download
1 / 25
250 likes | 388 Views
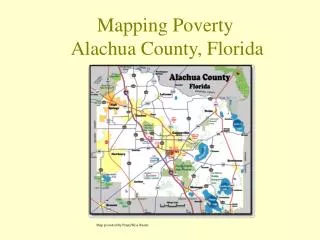
Mapping Poverty Alachua County, Florida. Map provided By PennyWise Realty. Purposes of Our Study. To explore patterns of poverty within Alachua County using specific poverty indicators To Implement ARCGIS and ARCMAP programs to present a spatial analysis of this data.

E N D
Mapping Poverty Alachua County, Florida Map provided By PennyWise Realty
Purposes of Our Study • To explore patterns of poverty within Alachua County using specific poverty indicators • To Implement ARCGIS and ARCMAP programs to present a spatial analysis of this data. • To present this data in a spatial format to aid in decision making process for striving toward reduced poverty in the county
Alachua County • Located in North Central Florida • Population of approximately 223, 578 • 24% of population living below the poverty level • Includes the cities of Alachua, Archer, Gainesville, Hawthorne, High Springs, La Crosse, Micanopy, Newberry, and Waldo.
Poverty Indicators • We looked at three variables we feel are linked to poverty. 1. Economic Indicators 2. Sociodemographic Indicators 3. Vulnerability Indicators
Economic Poverty Indicator • We determined an economic indicator of poverty by using the established census bureau guidelines and then creating 3 levels of High, Medium and Low Poverty based on aggregated income levels and household income using established census block groups.
Economic Poverty Levels • High Poverty :Income $10,000 – 13,999 • Medium Poverty:Income $ 14, 000 -16, 999 • Low Poverty: Income $ 17,000- 20, 000
Socioeconomic Indicator • We explored the relationship between poverty and key ethnic groups to look for suggestive trends.
High poverty rates tend to correspond with high Hispanic population abundance
Medium poverty rates tend to correspond with medium African American population abundance
Low poverty rates tend to correspond with high Caucasian population abundance except in SW Gainesville
Socioeconomic Indicator • We also looked at education levels as they relate to poverty.
Socioeconomic Indicator • There are less individuals receiving diplomas in rural areas • Suggests that social programs should be extended to these areas to ensure high school completion
Vulnerability Indicator • We chose to look at two types of vulnerability indicators; environmental vulnerability and availability to services vulnerability.
Availability to Services Vulnerability • Those factors we considered important include presence of fire departments, hospitals, schools, transit routes and sewer. These factors contribute to social poverty by making it difficult for individuals in areas where there are fewer available services. A reduced access to services means reduced opportunities and increased safety risks.
Environmental Vulnerability • Environmental vulnerability factors contribute to an impoverished circumstance for those individuals living in areas because they influence the quality of air, water and soil. They influence the kind of risks to which people in these areas are exposed.By extension, this may further depress the economics of areas if individuals exposed to contaminants become sick and do not have adequate if any insurance to cover medical expenses.
Environmental Vulnerability • The factors we considered to be significant include location of hazardous waste sites, sewage treatment plants and pipe placements, solid waste sites and superfund sites.
In Conclusion • Most impoverished areas in Alachua fall within the rural areas outside of city boundaries and within Gainesville boundaries in the North East area of the city. • Most services found within urbanized areas and less in rural
In Conclusion • Hazardous waste sites predominately in lower sociodemographic regions within city boundaries while sewage treatment plants are more equally distributed throughout Alachua • Superfund site located in Gainesville boundaries within one of the poorest communities