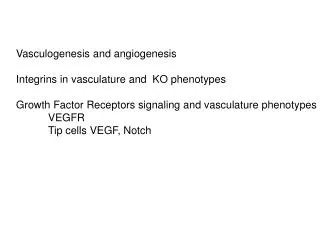
Modelling Vasculogenesis
Modelling Vasculogenesis. Division of Molecular Angiogenesis Inst. Cancer Research and Treatment Candiolo (TO). Dept. Mathematics Politecnico di Torino. D. Ambrosi A. Gamba R. Kowalczyk L. Preziosi V. Lanza A. Tosin. F. Bussolino E. Giraudo G. Serini. Cellular level.

Modelling Vasculogenesis
E N D
Presentation Transcript
Modelling Vasculogenesis Division of Molecular Angiogenesis Inst. Cancer Research and Treatment Candiolo (TO) Dept. Mathematics Politecnico di Torino D. Ambrosi A. Gamba R. Kowalczyk L. Preziosi V. Lanza A. Tosin F. Bussolino E. Giraudo G. Serini
Cellular level Sub-cellular level Tissue level lymphocytes T helper lymphocytes T killer macrophages plasma cells Endothelial cells Dal punto di vista fisiologico la descrizione degli aspetti che giocano un ruolo inportante nello sviluppo e nella crescita dei tumori e’ molto complicato. Molto dipende dall’ingrandimento utilizzato dal biologo nel descrivere i fenomeni o da chi vuole sviluppare i modelli matematici. Ci si puo’ infatti focalizzare sugli aspetti macroscopici e descrivere - la crescita dello sferoide multicellulare nella fase avascolare (ossia quando non si e’ ancora circondato di una propria rete di capillari) - o il processo di angiogenesi (i.e. la crescita di questa rete), - o la fase vascolare, - o il distacco di metastasi ed i meccanismi di diffusione ed adesione nei siti secondari. Tutto cio’ pero’ dipende da quanto succede ad un scala ancora piu’ piccola, la scala cellulare. Bisogna tener conto che le cellule tumorali interagiscono con altre cellule dell’organismo (cellule endoteliali, del sistema immunitario) e che esse stesse, come dei Pokemon, evolvono. Infine, il risultato di queste interazioni dipende da cosa succede ad una scala ancora piu’ piccola: la scala cellulare (degradazione del DNA, espressione dei geni, trasduzione dei segnali, adesione cellulare). Quindi il problema matematico viene ad essere intrinsecamente multi-scala. tumour cells
The progression of a normal cell into a tumor cell implies several key steps Tumour Progression
Angiogenesis Proliferation Migration Organisation Stimulation VASCULOGENESIS ON “MATRIGEL”
2h 30’ 1h 4h 10h 12h 14h 6h 8h VASCULOGENESIS ON “MATRIGEL”
Let me mention that vasculogenesis in vitro is a standard test used by pharmaceutical companies and research centres to test the validity of antiangiogenic drugs Cords: Dose Response Control 0.001 mM 0.01 mM 0.1 mM 1 mM 10 mM 100 mM (Courtesy: Pharmaceutical Institute Mario Negri - Bergamo)
n = 50 cells/mm2 n = 100 cells/mm2 n = 200 cells/mm2 n = 400 cells/mm2 Questions • What are the mechanisms driving the generation of the patterns? • Why is the size of a successful patchwork nearly constant? • What is the explanation of the transition obtained • for low and high densities? • Is it possible to “manipulate” the formation of patterns?
Assumptions • Cells move on the Matrigel surface and do not duplicate • The cell population can be described by a continuous • distribution of density n and velocity v • Cells release chemical mediators (c) • Cells are accelerated by gradients of soluble mediators • and slowed down by friction(chemotaxis) • For low densities (early stages) the cell population can be • modeled as a fluid of non directly interacting particles • showing a certain degree of persistence in their motion • Tightly packed cells respond to compression
Serini et al., EMBO J. 22, 1771-9,(2003) calvino.polito.it/~biomat calvino.polito.it/~preziosi D. Ambrosi, F. Bussolino, L.P., J. Theor. Med., (2004)
Mathematical Model a = diffusion coefficient b = attractive strength g = rate of release of soluble mediators t = degradation time of soluble mediators e = friction coefficient a = typical dimension of endothelial cells x = (a t)1/2 ~ 0.1-0.2 mm a ~ 10-7 cm2/s t ~ 103 s~ 20 min a ~ .02 mm D. Ambrosi, A. Gamba, G. Serini, Bull. Math. Biol., (2004)
p = 0 blow-up Keller Segel p = ln n no blow-up p = convex R. Kowalczyk, J. Math. Anal. Appl., (2005) Mathematical Model
Temporal evolution 0 h 3 h 6 h
Temporal evolution n = 50 cells/mm2 n = 100 cells/mm2 n = 200 cells/mm2 n = 400 cells/mm2
Phase transition Percolative transition A. Gamba et al., Phys. Rev. Letters, 90,118101 (2003) Swiss-cheese transition R. Kowalczyk, A. Gamba, L.P. Discr. Cont. Dynam. Sys. B 4 (2004)
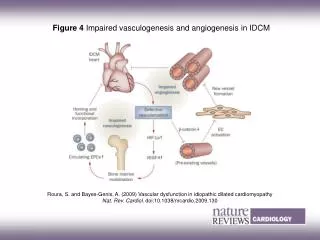
Fong, Zhang, Bryce, and Peng “Increased hemangioblast commitment, not vascular disorganization, is the primary defect in flt-1 knock-out mice” Development126, 3015-3025 (99)
Percolative transition A. Gamba et al., Phys. Rev. Letters, 90 (2003) Percolative transition ~ 90 cells/mm2 Fractal dimension A quantity that can give us information about the structure of the percolating cluster at different scales is the density of the percolating cluster as a fanction of the radius. This is defined as the mean density of sites belonging to the percolating cluster, inclosed in a box of side r. This shoud scale as r^(D-d). For a percolating cluster of random percolation at the critical point, one expects a fractal dimension D=1.896. We found it. The value 1.50 may be the signature of the dynamic process that lead to the formation of the clusters (driven for r>rc by the rapidly oscillating components of the concentration field) Percolative probability, Mean cluster size, Cluster mass, Sand-box method Density of percolating cluster D=1.5 ~rD/r2 r D=1.87 .8
Swiss-cheese transition Stability of the uniform distribution R. Kowalczyk, A. Gamba, L. Preziosi Discrete and Continuous Dynamical Systems
C. Ruhrberg, H. Gerhardt, M. Golding, R. Watson, S. Ioannidou, H. Fujisawa, C. Betsholtz, and D.T. Shima, “Spatially restricted patterning cues provided by heparin-binding VEGF-A control blood vessel branching morphogenesis”, Genes & Development 16, 2684–2698 Figure 2. The balanced expression of heparin- binding VEGF-A versus VEGF120 controls microvessel branching and vessel caliber. (A) Schematic representation of hindbrain vascularization between 10.0 (1) and 10.5 (4) dpc; between 9.5 and 10.0 dpc, the perineural vascular plexus in the pial membrane begins to extend sprouts into the neural tube (1), which grow perpendicularly toward the ventricular zone (2), where they branch out to form the subventricular vascular plexus (3,4). (B,C) Microvessel appearance on the pial and ventricular sides of a flat-mounted 12.5-dpc hindbrain; the midline region is indicated with an asterisk; the pial side of the hindbrain with P, the ventricular side with V. (D–F) Visualization of vascular networks in representative 500-µm2 areas of the 13.5-dpc midbrain of wt/wt (D), wt/120 (E), and 120/120 (F) littermates;
Saturation with VEGF Control Saturated
Cell migration analysis of ECs plated on Matrigel in the absence or the presence of saturating amount of VEGF-A. Histograms of , cos , , and cos (see Fig.2D) for the trajectories of ECs plated on Matrigel either in control culture conditions (green) or in the presence a saturating (20 nM) amount of VEGF-A165 (light blue). The observed densities of cos and cos were fitted with Beta distributions (red lines) by maximum likelihood. The observed densities in VEGF-A165 saturating conditions are markedly more symmetric than those observed in control conditions, showing loss of directionality in EC motility. Histograms of indicate that also after extinguishing VEGF-A gradients EC movement on Matrigel maintains a certain degree of directional persistence. However, histograms of show that in the presence of saturating amount of VEGF-A165 EC movement is completely decorrelated from the direction of simulated VEGF gradients. We checked the hypothesis that values in saturating conditions are uniformly distributed by performing a goodness-of-fit test (p = 0.397). The same test applied to the values in control conditions gives a p= 3 x 10⁻⁸, which allow to reject the hypothesis at any reasonable significance level. Persistence Directionality Control Saturated
Anisotropic case V. Lanza
Exogenous control L L L’ chemoattractant chemorepellent
Exogenous chemoattrantant Source in the center V. Lanza Source on the sides
Exogenous chemorepellent Line Source Point Source
Exogenous chemorepellent new characteristic length action range of chemorepellent • Parameters used give: • In dimensionless form:
Exogenous chemorepellent new characteristic length action range of chemorepellent • Parameters used give: • In dimensionless form:
Vascularization:Tumor vs. Normal Physiological observations: • Increased vessel permeability • Increased proliferation of EC • Abnormal blood flow • Swelling (dilatation) • Increased tortuosity • Abnormal branching • Presence of blind vessels • Loss of hierarchy • Increased disorder
Not only this but even from tumor to tumor one can identify tumor aggressiveness from the degree of “disorder” of the vascular network sorrounding it. The wish of medical doctors would be to identify the quantities which are important to monitor to quantify the abnormality Vascularization:Tumor vs. Tumor Aim: Distinguish the morfological characteristics to quantify the abnormality • Identify with non invasive techniques • the existence of abnormal morfologies • Quantify the progression state of the • tumor • Quantify the efficacy of drugs Konerding M. et al Am J Pathol 152: 1607-1616, 1998