Download

1 / 25
250 likes | 350 Views
This study investigates the impact of Medicare spending and technological advances on health care inequality, utilizing data from the 1990s. The research explores disparities in outcomes related to income, education, and ethnicity. Various approaches are used to measure full income and life extension value, shedding light on the distribution of health care benefits among the elderly population.

E N D
Medicare Growth, Technological Advances, and the Distribution of Health Care Benefits Jonathan Skinner Weiping Zhou
A Simple Question Have the billions of health care dollars spent during the 1990s improved or worsened inequality in health and well-being in the elderly population?
A Not So Simple Answer • Expenditures/utilization for health care: High income people get: • Less (Battachyaria and Lakdawalla, 2003)) • More (Le Grand, 1982; McClellan and Skinner, 2003, Sanchez et. al., 1992).
A Not So Simple Answer • Improvements in Outcomes: High education / non-minority people get • Less (McDermott, 1978) • More ( (Glied and Lleras-Muney, 2003; Goldman and Smith, 2002; Lichtenberg and Lleras-Muney, 2002)
A Not So Simple Answer • Improvements in Outcomes: High education / non-minority people get • Less (McDermott, 1978) • More ( (Glied and Lleras-Muney, 2003; Goldman and Smith, 2002; Lichtenberg and Lleras-Muney, 2002) • How do you measure inequality in health or in full income anyway?
Our Strategy • Expenditures: Fuchs proto-full income measure (Medicare expenditures plus adjusted CPS income) • Data sources: Current Medicare History Survey (CMHS), CPS
Our Strategy • Expenditures: Fuchs proto-full income measure (Medicare expenditures plus adjusted CPS income) • Data sources: Current Medicare History Survey (CMHS), CPS • Outcomes: CMHS • Utilization: Cooperative Cardiovascular Project (CCP) data on heart attack patients (1994/95) • Two measures of income: per capita family (CPS) and zip code (CMHS, CCP)
Percentage Increase in Full Income (1): Money Income plus Medicare Expenditures, 1992-2001
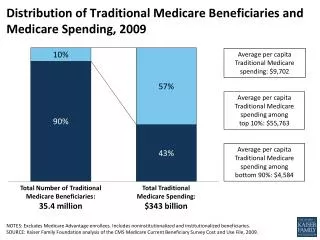
Medicare Expenditures (Males Age 80-84) 1987 and 1997, by Income Decile Source: McClellan and Skinner, 2003
How Big is a Big Twist? • Decile 10 spending increase ($3300) less Decile 1 spending increase ($1600)
How Big is a Big Twist? • Decile 10 spending increase ($3300) less Decile 1 spending increase ($1600) • Average EITC Payments per family receiving EITC (1997) Source: Brookings-Urban Website
1997$ 2500 Lowest Income Decile 2000 Highest Income 1500 Decile 1000 500 0 1989 1987 1993 1995 1997 1999 2001 1991 Average Home Health Care Spending By Decile 1987-2001: Men Age 80-84 in 1987
Next Measure: Changes over time in Income Including Lifespan
How Does One Place a Dollar Value on Lifespan Extension? • Approach number 1: value gains in life-years for low income households by more (Cost-Benefit Analysis) • Approach number 2: Value gains in life-years for low income households by less (Becker et. al. “WTP”)
10-Year Survival Rates Rose in Highest Income Deciles by More than in Lowest Income Deciles 1992-2001 1982-91
Percentage Increase in Full Income (2): Money Income plus Value of Life Extension, 1992-2001
A Third Approach: Focus on Utilization of “Effective” Technological Innovations
Causes of 90-Day AMI Mortality Decline, 1975-1990Source: Heidenrich and McClellan, 2001 No Significant Impact: CABG, calcium antagonists, PTCA (non-primary), nitrates, anticoagulants, etc.
100.0 80.0 60.0 40.0 20.0 0.0 Beta Blocker Use By RegionSource: Dartmouth Atlas Percent of “Ideal” Patients Receiving Beta Blockers at Discharge Following AMI (1994-95)
Income per Capita in 2000 andAverage 1-Year AMI Mortality (1989-2000) by State
Putnam’s Social Capital Index andAverage 1-Year Mortality (1989-2000) by State
Medicare Expenditures (Age 70-74 M) by Year (1982-91 or 1992-2001) Decile 1 in 1992 Decile 10 in 1992 Decile 1,10 in 1982