Download

1 / 50
500 likes | 520 Views
Explore the utilization of primary care systems like NHS Direct and QRESEARCH in the UK for monitoring heat-related illnesses and early warning of health protection issues. Learn about the benefits and methodologies adopted for real-time surveillance.

E N D
Using Primary Care Data for ‘Real Time’ Health Protection Surveillance Gillian Smith on behalf of primary care surveillance team
Birmingham – all the ‘B’s ‘Bullring’ ‘Bilbo Baggins’ ‘Baltis’
Outline • Why do we need real time surveillance? • What primary care systems could we use? • Two examples of primary care systems used in the UK: • NHS DIRECT • QRESEARCH • How have these systems been used in heat related illness? • Discussion about way forward
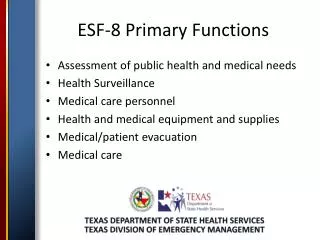
Why do we need health protection surveillance in primary care? • Clinical diagnoses made by GPs (and symptoms reported to NHS Direct) offer the ability to systematically monitor a variety of syndromes/symptoms which could give early warning of a health protection issue (microbiological/chemical/radiological) • To monitor milder illnesses which may not present to hospitals • To monitor illnesses for which laboratory specimens not taken ( e.g. influenza,chicken pox) • Assess burden of of infection in primary care • To assess impact of health protection policies in primary care • To reassure that there has not been an increase in symptoms in the community
Overview of surveillance systems in UK • Pre primary care – based on reported symptoms ( NHS Direct) • ‘Spotter schemes’ based on consultations (e.g. RCGP) • GP databases ( e.g. GPRD and QRESEARCH)
Principles of work • In collaboration with colleagues working in primary care • Work on syndromes which may be related to infection, chemicals or environmental causes therefore across the HPA • Focus on areas where primary care data can provide ‘added value’ to the overall picture
Background to NHS Direct • NHS Direct is a telephone health help line. • Open 24 hours a day, 365 days a year • Aims to provide the public with health • advice and information • First introduced in 1998, providing a • service in 3 pilot areas • Now service covers the whole of England and Wales • 22 sites covering 2.5 million people each
Aim • The aim is to identify an increase in symptoms that may be caused by the deliberate release of a biological or chemical agent, OR MORE COMMON INFECTIONS/ HEALTH PROTECTION ISSUES
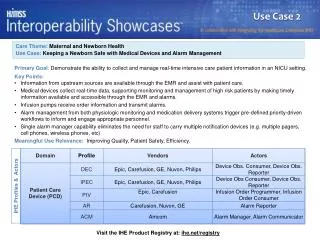
How the project works NHS Direct site 1 NHS Direct site….. NHS Direct site... NHS Direct site 22 Data collection NHS Direct National Operations Centre Health Protection Agency West Midlands Regional Surveillance Unit Analyses Health Protection Agency Other agencies Dissemination NHS Direct sites Health Protection Units NHS Direct National Team Department of Health PCTs/SHAs
Data collection • Call data on 10 ‘key’ symptoms/syndromes are transferred each week day from the 22 call centres (covering all of England & Wales) to the Health Protection Agency at West Midlands • Cold/flu Cough Fever Difficulty breathing • Vomiting Diarrhoea • Double vision Eye problems Lumps Rash • Heat stroke monitored during summer months • Call data are broken down by site, symptom, age-group and call outcome • Further details of individual calls including postcodes can be requested if needed
Analysis - control charts • Control charts constructed for 6 algorithms for 10 sites (major urban centres). • Model constructed assuming the Poisson distribution using the Gamma distribution to account for over-dispersion. • Incorporate a bank holiday and seasonal factor with a day factor and time trend factor included if required. • 99.5% prediction limits are calculated for each day. The prediction limit for the "future" is based on the average number of total calls to-date. • 99.5% upper prediction limits are also constructed for the remaining sites and algorithms (where control charts are not available) using standard formula (bank holiday/day/time trend factors not included).
Proportion of NHS Direct fever calls (5-15 year age group) by region
Benefits of daily call data • Provided an early indication of a rise in illness • Surveillance of children not necessarily visiting GPs or hospitals • Response to media - confirmation of regional levels • Daily reporting when needed • Ongoing monitoring
NHS Direct callers self-sampling study 2004/05 • Aims of study to answer the following questions: • 1) Can self-sampling by callers to NHS Direct give early warning of an increase in influenza activity in the community? • 2) Does self-sampling by callers to NHS Direct provide added value over existing surveillance systems for influenza? • 3) What are the implications of introducing self–sampling for influenza testing to NHS Direct callers and to the NHS Direct service?
Sampling: 2004/2005 • November 2004 – February 2005: NHS Direct callers (>15 yrs) in Hampshire, West Midlands and South Yorkshire reporting ‘cold/flu’ were recruited by NHS Direct nurses • Each caller was sent specimen kits containing 2 nasal swabs, viral transport medium, instructions and information, packaging and a pre-paid reply envelope • Callers were asked to return kits to the HPA virus lab & samples were tested by multiplex PCR for Influenza and RSV viruses, and if (+) cultured for viable virus isolation • Results were sent back to national influenza surveillance team within the HPA CfI and to the NHS Direct callers
Results • Response rate: 294 kits sent out - 142 samples (48%) returned • Positivity rate: 23 of 142 samples (16.2%) tested positive for influenza viruses. Positivity was 30-40% during peak weeks • Influenza: 23 samples • Influenza A (H1N1): 3 • Influenza A (H3N2): 16 • Influenza B: 4 • RSV: 8 samples • Positive samples included the 2nd community sample of influenza A (H1N1), 4th of influenza A (H3N2) and 1st influenza B sample received by the ERNVL during the 2004/2005 influenza season. • 7 of 141 callers reported minor problems in taking swabs • Average time from NHS Direct call to result was 7 days
Conclusions from sampling project • Self-sampling by NHS Direct callers provided early warning of influenza circulating in the community and detect multiple strains of the virus • The added value of the scheme may lie in providing early warning of influenza rather than ongoing surveillance throughout the entire season • Despite spending on average a week in transit the samples provided good viability for antigenic characterization (virus growth by culture) as well as for molecular detection • Proof of concept that the NHS Direct community sampling tool can provide high quality and timely samples
HPA/Nottingham University Surveillance Project: What is QRESEARCH? • A non-profit making, nationally representative sample of volunteering general practices (500) who use EMIS general practice computer systems • Includes data on 8.2 million patients (4 m current) • Some practices have up to 10 years of historical data on the database • Patients and practices within the database are completely anonymous – no personal/practice identifiers are recorded • QRESEARCH ‘added value’ lies in the ability to link to prescribing data and to undertake analyses using socio-economic data (Census, Townsend, IMDS, Rurality score etc) uploaded to the patient records
HPA/Nottingham University Surveillance Project EMIS FILESERVER QRESEARCH FILESERVER IN NOTTINGHAM Episodic data transfers GENERAL PRACTICE TEAM Download of all coded data and then daily downloads Extraction of subsets for researchers & morbidity analyses Recruitment and informed consent Activation of QRESEARCH GP PRACTICE CLINICAL COMPUTER QRESEARCH TEAM IN NOTTINGHAM
HPA/Nottingham University Surveillance Project: What is it? • In April 2004 received funding from HPA for a two year pilot project - project now extended to March 2008 and funding provided for daily data provision ( influenza indicators) • Aim to investigate the feasibility of providing weekly surveillance data and using the QRESEARCH database for a number of strategic projects
HPA/Nottingham University Surveillance Project: routine outputs • Pilot Weekly Bulletin launched on 11th November 2004 with three ‘key’ indicators – influenza-like illness; influenza-like illness with anti-virals prescribed; vomiting • Each week the bulletin includes a ‘key messages’ section, highlighting changes to the indicators • Gradually extended indicators • Widened distribution of bulletin in July 2005 • Evaluation of usage by HPA and NHS to be conducted in 2006/07
Influenza-like illness Pneumonia Severe asthma Wheeze Vomiting Diarrhoea Gastroenteritis Mumps Measles Pertussis Heat stroke Influenza-like illness with anti-virals prescribed Uptake of influenza vaccine Proportion of those under 5 years with diarrhoea prescribed re-hydration therapy Impetigo and the proportion treated with fusidic acid Key indicators – monitored weekly (could be monitored daily)
Weekly bulletins are produced every week including over Christmas and New Year Includes data for the previous week for a set of key indicators which are presented at UK, country, region and SHA level The weekly bulletin Insert Image
HPA/Nottingham University Pilot Surveillance Project: routine outputs UK GP consultation rate (per 100,000) for Influenza-like illness, 2005/6 Source: QRESEARCH weekly outputs
HPA/Nottingham University Pilot Surveillance Project: routine outputs UK GP consultation rate (per 100,000) for Influenza-like illness with anti-virals prescribed, 2005/6
HPA/Nottingham University Pilot Surveillance Project: routine outputs GP consultation rate for influenza-like illness by Region (rate per 100,000) 2005/6 Source: QRESEARCH weekly outputs
Buncefield incident • Able to provide information • on consultations to SHA • level (and PCT) • Able to monitor range of conditions (as per bulletin) • ‘Switched on’ daily reporting and piloted extended flu data set • No unusual increase in respiratory or complaints e.g. asthma etc. • Able to provide data ‘real time ‘ to incident team
Pandemic influenza planning • Data required daily – now have capability to do this for weekdays (can be ‘switched on’ in two days) • Can provide data to PCT level • Extended dataset for influenza related conditions and prescribing (QFlu available on 17 million patients) • QFlu has practices from every SHA in England and from 292 out of 303 PCTs • Can provide data on UK ( 30% overall - though under- represented in Scotland) • included in bulletin in last few weeks
So what has happened as a result of your work? • EARLY WARNING AND TRACKING OF RISES IN LLNESSS IN THE COMMUNITY • Part of influenza surveillance system and DH ‘heat health watch project’ (exploring utility for environmental monitoring) • Ability to detect sudden rise in symptoms/syndromes in the community, both at a national, regional level and now local level ( e.g. norovirus, influenza like illness) • Able to provide weekly uptake estimates for adult vaccinations • Only national daily surveillance system in UK and only national surveillance system using a health help-line in the world • PROVIDING REASSURANCE DURING TIMES OF PERCIVED HIGH RISK • e.g. Ricin incident , London bombings and Buncefield – data used by incident teams and quoted publicly by HPA • MONITORING OF HEALTH PROTECTION POLICIES • e.g. use of antibiotics post SMAC report - increase in three day courses (compared to longer course) of trimethoprim for UTIs)
Summary – So what has happened as a result of your work? (contd.) • EXERCISES • Daily data used regularly in Exercises ( e.g. heat wave, bioterrorist and influenza) and provided only consistent daily data feed for Exercise United Endeavour • PANDEMIC INFLUENZA PLANNING • Helped in stopping proliferation of local ‘spotter practice’ schemes ( as part of influenza pandemic planning) to monitor FLI - will be provided in consistent and standard way • Able to provide information on where anti-virals being used for FLI • NHS Direct can provide an alternative source of specimens if needed (from patients directly) • Provided daily data for modellers • PEER REVIEWED PUBLICATIONS
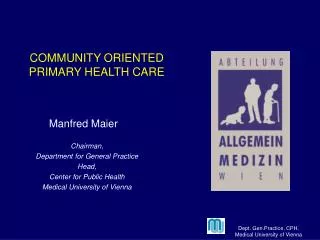
Lasted 2 weeks in France 4th hottest summer on record in UK Brogdale near Faversham (Kent) recorded England's highest temp 38.5 °C on 10 Aug Previous record 37.1°C Cheltenham, 3 Aug 90 32 °C was exceeded on three consecutive days between 4 and 6 August and then on five consecutive days between 8 and 12 August, somewhere in the UK But in 1976, temperatures exceeded 32 °C (90 °F), somewhere in the UK, on 15 consecutive days starting 23 June. August 2003 Heat-wave Temperature distribution across Europe on 10 August 2003 at 1500hrs British Summer Time
‘Heat-health watch’ • Heatwave plan for England and Wales - Summer 2004 • “By the time a heatwave starts the window of opportunity for effective action is very short indeed…” • “The HPA, in collaboration with NHS Direct, will refine mechanisms for the surveillance of increased heat-related illness with the aim of being able to provide daily real-time reports to the Department of Health.” • “These will provide a source of intelligence on (a) how severe the effects are, and (b) how well services are responding.” • DH - Heatwave Plan - 2004 [data:NHS Direct & Met Office]
Published by Department of Health26 July 2004 http://www.dh.gov.uk/PublicationsAndStatistics/Publications/
Level Trigger Response Level 1 - Awareness No warning required unless there is 50% probability of the situation reaching Level 2 somewhere in UK in next 5 days. • Minimum state of vigilance. • Department of Health issues general advice to public and health care professionals • Regional directors of public health review utility suspension policies. • PCTs and Social Service departments review the identification of individuals at risk. • NHS Trusts review resilience of infrastructure and equipment. Level 2 - Alert Met Office forecast of threshold temperatures for at least three days ahead in any region, or 80% chance of temperatures exceeding threshold on 2 consecutive days. In addition to above: • Department of Health issues specific advice to general public. • Targetted media strategy. • PCTs and Social Service departments distribute advice to at-risk individuals and managers of care homes. Level 3 – Heatwave Met Office confirms threshold temperatures exceeded in any one region. In addition to above: • Regional directors of public health ensure no utility suspensions. • PCTs and Social Service departments commission additional care and support to ensure daily contact with vulnerable individuals. • Hospitals and trusts alerted in case there is increase in admissions. Level 4 - Emergency Heatwave is “very severe or prolonged”. In the event of a “major incident” being declared, all existing emergency policies and procedures will apply.
Level 1 The Health Protection Agency, in collaboration with NHS Direct,will refine mechanisms for the surveillance of increased heat-related illness with the aim of being able to provide daily real-time reports to the Department of Health. These will provide a source of intelligence on (a) how severe the effects are, and (b) how well services are responding. Level 2 The Health Protection Agency will continue surveillance of increased heat related illness reflected in calls to NHS Direct and GP consultations to provide daily real-time reports to the Department of Health. These will provide a source of intelligence on (a) how severe the effects are, and (b) how well services are responding. Level 3 Same as for Level 2 Level 4 In the event of a ‘major incident’ being declared, all existing emergency policies and procedures will apply. All Level 3 responsibilities will also continue. HPA responsibilities
Is there utility and if so how might we improve this? • Can primary care data provide any ‘added value’ in either early detection of health problems or assessing size of health problems? • What morbidity indicators would be useful? – now ability to look at more unusual endpoints (neurological) • Can we be ‘clever’ in our prescribing linked to morbidity indicators? • ?? Select risk groups for ongoing surveillance (able to do so with new GP system) • When should we ‘switch on’ daily reporting?