Download
1 / 35
460 likes | 701 Views
Trees, taxonomy & location: mapping phylogeography using Biodiverse. Dan Rosauer & Shawn Laffan University of New South Wales & Centre for Plant Biodiversity Research. Taxonomic Databases Working Group 22 October 2008. New tools and measures for practical phylogenetic diversity analysis.

E N D
Trees, taxonomy & location:mapping phylogeography using Biodiverse Dan Rosauer & Shawn Laffan University of New South Wales & Centre for Plant Biodiversity Research Taxonomic Databases Working Group 22 October 2008
New tools and measures for practical phylogenetic diversity analysis • Tools:Biodiverse – a tool for spatialanalysis of biodiversity • Measures:Phylogenetic Endemism - an index of localised evolutionary history
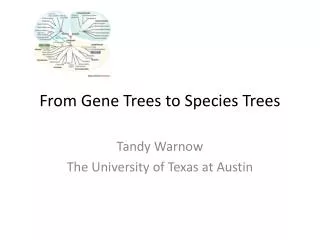
Summary area cladogram resulting from the analysis of Australian Rhamnaceae, tribe Pomaderreae. From Ladiges et al. 2005 Dung beetle evolution in Australia’s wet tropics – from Bell et al 2007 Why map phylogenies? (1) To study the spatial component of evolution…
Why map phylogenies? (2) Mammalian evolutionary hotspots in California Davis et al, 2008Molecular Ecology To inform biodiversity conservation… Red and yellow areas represent centres of current speciation. They are identified as important areas to protect for maintenance of evolutionary processes
Tuatara (2 species) after Rest et al (2003) Snakes & Lizards (several thousandspecies) Why map phylogenies? (3) Because diversity is not distributed equally between taxa… All species are equal, but some are more equal than others…
Phylogenetic diversity Part of an ITS tree for tribe Pomaderreae (Rhamnaceae)Kellerman et al (2005) Pomaderris elliptica
A practical slant on phylogenetic mapping • Theory and methods – robust but developing • Data (+ ability to access it) – exploding! • Specimen and survey data • Molecular data • Published phylogenies How can we make phylogenetic mapping more accessible and useful for study and management of biodiversity?
Biodiverse –a tool for spatial analysis of biodiversity • indices of richness, endemism, compositional dissimilarity, sampling redundancy • clustering • Monte Carlo randomisations …and now phylogenetic measures Mean genetic similarity in Pultenaea Bickford et al (2004) • Biodiverse has been used to investigate: • Endemism in the Australian Flora - Crisp et al (2001), Laffan & Crisp (2003) • Taxonomic and genetic patterns in Pultenaea (Fabaceae) - Bickford et al (2004) • Scale dependence of relationships between climate and fern species richness • - Bickford & Laffan (2006)
~25,000 herbarium and survey records for Daviesia (Fabaceae) loaded against chosen cell size (1 degree)
Display phylogeny D. ovata D. euryloba D. abnormis
Explore phylogeography View distribution of a clade View species list for selected clade
Explore phylogeography View distribution of a clade
Explore phylogeography View distribution of a clade
Explore phylogeography View distribution of a clade
Explore phylogeography View distribution of a clade
Select radius for neighbourhood analysis Choose from a range of analyses
Taxon name Stenanthemum leucophractum Linking spatial data to the tree via names Name on tree • Names in spatial data • - Stenanthemum leucophractum • - Cryptandra leucophracta • - Stenanthemum leucophractum (Schldl.) Reissek • - Cryptandra leucophracta Schltdl. • Stenanthemum leucophractum (Schltdl.) Reissek • Cryptanda leuc. Names matched using Australian Natural Heritage Assessment Toolover 75,000 formal & informal synonymies for Australian taxa matched with valid names from relevant authorities – eg ABRS, APNI STLE
Two ways to estimate endemism Absolute endemism • Estimate the species or PD restricted to a defined area • e.g. Sechrest et al (2002) Weighted endemism (for species) For each area: weighted endemism = sum of 1/range for species present Grid allows continuous variation – the data determines the areas of interest Williams & Humphries (1994) Crisp et al (2001)
Only in hotspots Hotspots & elsewhere Not in hotspots Primates in global biodiversity hotspots Sechrestet al 2002
Two ways to estimate endemism Absolute endemism (for species or PD) • Estimate the species or PD restricted to a defined area • e.g. Sechrest et al (2002) Weighted endemism (for species) • For each area: weighted endemism = sum of 1/range for species present • Grid allows continuous variation – the data determines the areas of greatest endemism • Williams & Humphries (1994), Crisp, Laffan, Linder & Monro (2001), Slatyer, Rosauer and Lemckert (2007)
Phylogenetic endemism a measure of the degree to which elements of evolutionary history are restricted in space Desirable properties of a phylogenetic endemism measure: • Spatially consistent • data define areas of endemism • allow comparison between equal areas • Independent of level • apply consistently to any taxonomic unit • Conceptually simple • flexibly applied to different problems and methods
Phylogenetic Endemism Calculate range for each branch, not each species Phylogenetic endemism (PE) = lengthA / range S.humile + lengthB / range S.humile & S.reissekii + lengthC / range S.humile & S.reissekii & S.petraeum & S.argenteum + …
A C B High PE Amount of shared PD Larger ================ Smaller A C B A A Low PE B B C C Phylogenetic Endemism (PE) contributed by an area with a narrowly distributed taxon A. Rosauer et al. (in prep)
This project is supported by an ARC Linkage Grant. • Partners: www.biodiverse.unsw.edu.au dan.rosauer@csiro.au Biodiverse software: Shawn Laffan Eugene Lubarsky (user interface) Dan Rosauer (phylogenetic functions) Thanks to: Mike Crisp Lyn Cook Marcel Cardillo Steve Donnellan Dan Rosauer is currently a visiting fellow at the Australian National UniversityCentre for Macroevolution & Macroecology