Risk Management using Dependency Structure Matrix
Risk Management using Dependency Structure Matrix. Ivan Petkovi ć ivan.petkovic @ elfak.ni.ac.rs Facult y of Electronic EngiNeering University of Ni š. Overview. Risk assessment & management What is Design Structure Matrix?

Risk Management using Dependency Structure Matrix
E N D
Presentation Transcript
Risk Management using Dependency Structure Matrix Ivan Petković ivan.petkovic@elfak.ni.ac.rs Faculty of Electronic EngiNeering University of Niš
Overview Risk assessment & management What is Design Structure Matrix? An efficient method based on DSM analysis for ranking component technology risk factors in a complex systems and processes Example: risk problem of NASA’s robotic spacecraft Implications on software development process
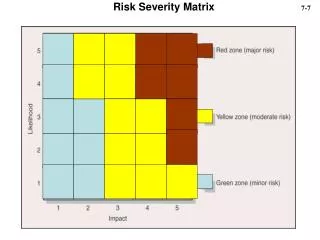
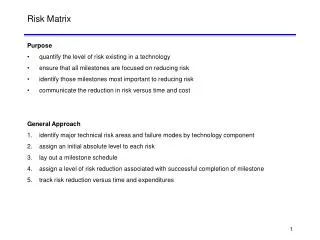
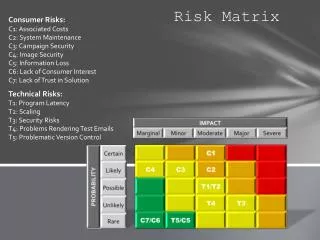
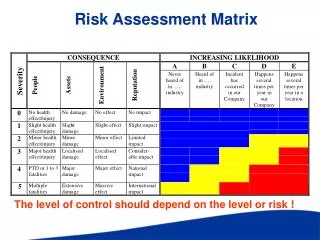
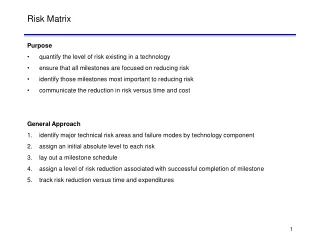
Risk management Universal applicability, not only for IT projects Risk assessment (identify risks and their impact) Risk mitigation (prioritize, implement & maintain risk reducing measures) Evaluation and assessment (continual process) Risk factor should be higher for entities upon other entities rely In large systems, interdependencies are common Display those dependencies using matrix
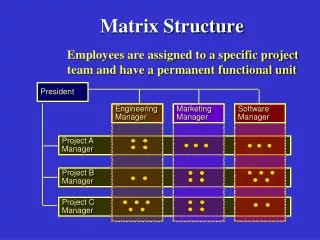
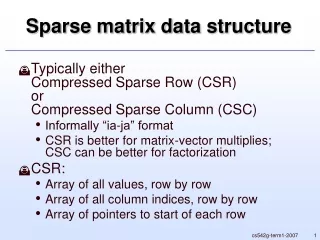
What is DSM? Use matrix consisted of individual tasks/entities within the process/system, Analyze relationship between these entities with the aim to identify the key structure of the system/process Entities are arranged into a square matrix A where each row and the corresponding column are associated to one of the tasks. This matrix is called the dependency structure matrix, or shorter DSM.
What is DSM? Values in each rowindicate dependency on other entites Higher the value, higher is their dependence. Values in column j indicate which other entities depend from the entity j. Diagonal entries of DSM are certainly equal to 0, since a component of a considered engineering system cannot influence itself.
DSM Strategy Divide process or system into individual entities (tasks / sub processes) Partition into Design modes Analyze interdependencies between entities
DSM partitioning Entity partitioning leads to creating an optimal “Design mode”(small sub matrix). Done byswitching columns and/or rows
Where is DSM used? Large systems and complex processes – dependency between smaller parts Software – complex relationship between assemblies or classes Process (e.g. Software development) – many smaller interdependent tasks Design iteration – interaction among design activities
Google and DSM PageRank – link analysis on webgraph Uses Power iteration (also eigenvalue algorithm) and Perron-Frobenuis theorem More incoming links to a page => more important
Google matrix of Cambridge University network (2006), N=212710
Technological risk DSM Obtained using values from the standard DSM multiplied with the risk factors - element aij from DSM is multiplied with the risk factors of i-th and j-th entity. For example, dependency value between H and J elements in the Fig. 1 is 4, risk factors for both components are 3, and that gives risk value of 36. Simplified example: NASA’s SAMPEX spacecraft
Prioritizing risks Ranking vector r =( r1 ,…, rj) The ranking place of an entity should be proportional to its risk, that is, Ar=λr where A is DSM Conclusion: r iseingenvector
Ranking the tasks According to the Peron-Frobenius theorem there is exactly one positive eigenvalue largest in magnitude ( equal to the spectral radius of A) and the corresponding eigenvector with positive elements. Eigenvector vm of the largest eigenvalue λmgives the ranking of the entities (risks in our case).
Risk assessment in software development process Identify risk factor for each work item (task or bug) TFS support exists Create dependency matrix Rank work items
Conclusion Including dependencies while assessing risks gives more realistic picture Add-on for TFS Using interval arithmetic in dependency matrix - more flexible estimation