Download
1 / 30
300 likes | 420 Views
This document provides an in-depth overview of instrumentation principles and practices used in laboratory settings. It focuses on the importance of precise measurement of isolated physical phenomena, utilizing both off-the-shelf and custom-built instruments. Key aspects such as data acquisition (DAQ) with LabVIEW, signal calibration, and noise considerations are discussed. Furthermore, the document elaborates on sample rates, bit resolution, and the significance of measuring accuracy and precision for effective analysis and understanding of experimental data.

E N D
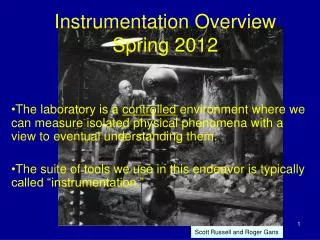
Instrumentation OverviewSpring 2012 The laboratory is a controlled environment where we can measure isolated physical phenomena with a view to eventual understanding them. The suite of tools we use in this endeavor is typically called “instrumentation.” Scott Russell and Roger Gans
Lab Instruments • Various, selected to measure what you want. • Off-the-Shelf or Scratch Built. • Must be calibrated. • Used with a PC or “stand alone.” • Responds to phenomena with some “signal.” • The signal is typically a voltage or current. • Instruments have varied response times, accuracy, and precision. • Here’s a cartoon of the process
Data acquisition (the measurement part) the lab Most of your data acquisition will be done using LabVIEW on a PC. You will learn how to do this early on. pressure, e. g. transducer LabVIEW: hardware/software voltage A/D conversion binary number computer
Some issues to be addressed: instrument response in time (transients, lag time) Measuring time-dependent phenomena accuracy and precision (system resolution) noise! (I’ll look at some of these in the context of temperature measurement another day. First I’d like to look at some ideas in general.)
From the lab to your dorm I(some language) • Sample rate refers to the number of data sets that can be processed (converted or decoded) per second. • If, for example, the sample rate is 1000 Hertz, then we are gathering 1000 snapshots per second of information (may be multidimensional) from the real world into the PC. • Bit resolution describes the precision of that sample, or how much discrete detail (significant figures) is captured in each snapshot . • The voltage signal from the instrument is converted to a binary number. The number of bits in the number determines the possible precision. • Resolution is therefore the SMALLEST DETECTABLE increment of measurement. • For PC-based DAQ, resolution is limited to the number of bits used to quantize or translate the analog to the digital signal.
Noise is just unwanted signal We’ll look at some real noise once we’ve played with the other stuff
From the lab to your dorm II(resolution) • DAQ devices are specified in terms of resolution — the number of bits in the converted binary number. • Consider a 14 bit instrument measuring a voltage between -1 and +1: 14-bits of resolution over a minimum range of ± 1 V. • What does this mean in terms of signal capture quality???? • The voltage resolution is (1 - (-1))V / (214) = 2 / (16384) V = 122 µV. • This is excellent for a voltage of 0.5, but useless for a voltage below 122 µV. • It also cannot distinguish between 0.5 and 0.5001; whether this is important depends on the problem • Let’s look at this graphically (for 0 < V < +1).
8 bit = 0.3984375 12 bit = 0.399902344 16 bit = 0.399993896
LabVIEW Overview Take a look Take a look Analyze Data (?) Read data Store data
The analysis part on the previous slide is not the final analysis It is often useful to do some preliminary analysis in LabVIEW BUT . . . Always save the original data as well as any processed data
From the lab to your dorm III(transport) The LabVIEW software can store data in Excel format You can take it away on a flash drive to analyze at your leisure
ON NOISE The air is full of EM signals range=±10 v Your instrument can pick them up range = ±10 mv
FILTERS cutoff = 10 Hz cutoff = 1 Hz
A quick introduction to LabVIEW All Programs —> Engineering —> National instrumentsLabVIEW (or something close to this) Select New Blank VI
You will get a Front Panel and a Block Diagram Each will have a palette
FRONT PANEL run stop controls palette run continuously
BLOCK DIAGRAM functions palette useful analytical tools are here much of what we want is here
CALIBRATION VIRTUAL INSTRUMENT dial in the independent variable, x read the dependent variable, y write the result to a file you will build one of these tomorrow
SIMPLE FRONT PANEL input, x allows writing to file value, y file name
SIMPLE BLOCK DIAGRAM writes x and y to a file acquires data combines x and y in a “vector”
DATA FILE THE HEADER
I can make LabVIEW do more or less what I want it to do, but Scott is a LabVIEW expert If Scott “helps” you too much, you will wind up with a LabVIEW program I cannot help you with!
About Gavett 244 Your ID should get you into the room Your UserID should allow you access to the machines You may have to change the password; they made me do that It takes close to two minutes for the log on process DO THAT FIRST
They wipe the machines overnight so bring a flash drive to take your stuff home with you