Download
1 / 13
130 likes | 259 Views
Constraints on Lyman continuum flux escaping from galaxies at z~3 using VLT narrow-band photometry. Akio K. INOUE 1 , I. IWATA, J.-M. DEHARVENG, V. BUAT, & D. BURGARELLA 1 Laboratoire d’Astrophysique de Marseille, FRANCE; akio.inoue@oamp.fr. Ionization history of the universe.

E N D
Constraints on Lyman continuum flux escaping from galaxies at z~3 using VLT narrow-band photometry Akio K. INOUE1, I. IWATA, J.-M. DEHARVENG, V. BUAT, & D. BURGARELLA 1 Laboratoire d’Astrophysique de Marseille, FRANCE; akio.inoue@oamp.fr Starburst 2004 at the Institute of Astronomy, Cambridge
Ionization history of the universe • Cosmic reionization epoch • End at z~6 (Becker et al.2001) • Start at z~17 (Kogut et al.2003) • How to proceed? • What is the main ionizing source; galaxies (stars) or others? • Can the ionizing photons escape from galaxies efficiently? • We will discuss the escape of Lyman continuum from galaxies. Starburst 2004 at the Institute of Astronomy, Cambridge
Lyman limit Steidel et al.(2001): the composite spectrum of 29 Lyman break galaxies at z~3.4. Lyman continuum escape • Steidel et al.(2001) succeeded in detecting the Lyman continuum photons from galaxies at z~3, whereas all the other attempts could not detect. • Spectroscopy was always adopted in the attempts, except for Malkan et al.(2003) who performed a broad-band photometry for z~1 galaxies and succeeded in obtaining the most strict upper limits on the escape fraction of Lyman continuum. Starburst 2004 at the Institute of Astronomy, Cambridge
Lya Lyman limit (z=3.2) Our approach • Narrow-band photometry • close to the Lyman limit (smaller IGM opacity) • very important for high-z galaxies • moderate sensitivity (better than spectroscopy) • select galaxies with an appropriate redshift to avoid any contamination of light above the Lyman limit. • The redshift criterion for the OII+44 filter of VLT/FORS is z~3.2. Starburst 2004 at the Institute of Astronomy, Cambridge
Observations • After the pre-selection of galaxies in the HDF-South based on the photometric redshift catalog of Labbé et al.(2003), we performed the spectroscopy with the VLT/FORS2 to know the accurate redshifts. • Because of unexpected systematic errors of the photometric redshifts, only two galaxies with an appropriate redshift were left in our sample. • We spent ~11 h exposure (on-source) toward the HDFS field through the narrow-band, OII+44 (central wavelength ~372 nm), filter with the VLT/FORS1. Starburst 2004 at the Institute of Astronomy, Cambridge
Observational results HDFS85 HDFS1825 Unit of the photometric data is nJy. ID of galaxies and U, B, V, I photometric data are taken from Casertano et al.(2000). Upper limits are 2-s. Starburst 2004 at the Institute of Astronomy, Cambridge
: intrinsic Lyman continuum (LC) flux : LC flux just outside of the galaxy : intrinsic UV flux, : UV flux just outside of the galaxy observed LC flux: observed UV flux: Definition of escape fractions • Absolute escape fraction: • Relative escape fraction: NOTE1: UV wavelength is set to be longer than Lya to be free from the IGM opacity. NOTE2: fesc,rel is not restricted to less than unity. Starburst 2004 at the Institute of Astronomy, Cambridge
Comparison of the data at z~3 a: this work, narrow-band (OII+44) photometry; b: Steidel et al.(2001), spectroscopy; c: Giallongo et al.(2002), spectroscopy; d: broad-band (U300) photometry. NOTE1: (FUV/FLC)int is given by a population synthesis model to calculate fesc,rel. NOTE2: tIGM is calculated by a model of the mean IGM opacity. Starburst 2004 at the Institute of Astronomy, Cambridge
Advantages of our approach • Narrow-band photometry can put the most strict constraint on the relative escape fraction for normal LBGs. • For individual galaxies, we have reached a similar level of FUV/FLC to the composite spectrum of 29 LBGs by Steidel et al. • Higher sensitivity of the broad-band U are lost by heavier IGM absorption because the effective wavelength in the source rest-frame is as short as ~700A. • Giallongo’s LBGs are ~4 times brighter than ours and Steidel’s. Starburst 2004 at the Institute of Astronomy, Cambridge
To estimate absolute escape fraction • Absolute escape fraction is • FLCint and tLCIGM can be estimated by a multi-color SED fitting. • “Physically” based SED fitting method: • NOT just a c2 fitting. • ISM dust and IGM absorption amounts, age, and SFR can be estimated from B, V, I, K data, assuming dust attenuation law (e.g. Calzetti’s law), IGM cloud number distribution (only functional shape), metallicity (e.g. 40% of solar), and constant star formation history. Starburst 2004 at the Institute of Astronomy, Cambridge
V-I B-I IGM absorption dust attenuation Physically based SED fitting red: Solar, blue: 1/5 Solar, green: 1/20 Solar metallicity • A unique solution in (tISM,tIGM)can be found from observed B-I and V-I because the significance of the IGM absorption is different between B and V. • However, to do that, we have to know the intrinsic spectrum which depends on SFH and metallicity. • Assuming a constant SFR, I-K is a good indicator of the age. Metallicity effect is secondary. Starburst 2004 at the Institute of Astronomy, Cambridge
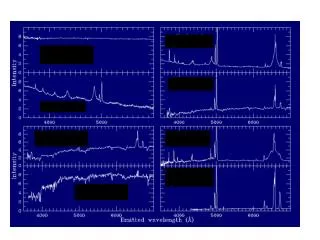
H K I H I K V B J V J B U U OII+44 OII+44 Fitting results Unit of flux density is nJy and upper limits are 2-s. NOTE: tIGM relative to a mean one is estimated by the fitting. Starburst 2004 at the Institute of Astronomy, Cambridge
Conclusions • We did not find any significant escape of Lyman continuum from two Lyman break galaxies (LBGs) at z~3 through the narrow-band photometry with VLT. • The two LBGs have a small absolute escape fraction, less than 10—30%. • For the moment, the sample size is too small to conclude that many LBGs have a small escape of Lyman continuum. • Narrow-band photometry can put a stronger constraint on the escape fraction of individual normal LBGs than spectroscopy and broad-band photometry. Starburst 2004 at the Institute of Astronomy, Cambridge