Download
1 / 48
480 likes | 506 Views
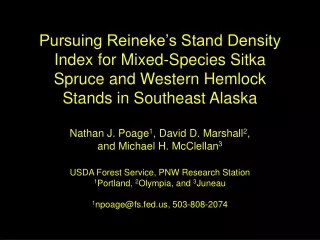
Pursuing Reineke’s Stand Density Index for Mixed-Species Sitka Spruce and Western Hemlock Stands in Southeast Alaska Nathan J. Poage 1 , David D. Marshall 2 , and Michael H. McClellan 3 USDA Forest Service, PNW Research Station 1 Portland, 2 Olympia, and 3 Juneau 1 npoage@fs.fed.us, 503-808-2074.

E N D
Pursuing Reineke’s Stand Density Index for Mixed-Species Sitka Spruce and Western Hemlock Stands in Southeast AlaskaNathan J. Poage1, David D. Marshall2,and Michael H. McClellan3USDA Forest Service, PNW Research Station1Portland, 2Olympia, and 3Juneau1npoage@fs.fed.us, 503-808-2074
Overview of Talk • Introduction and Background• Cooperative Stand Density Study• Determining SDImax of Mixed Spruce- Hemlock Stands in Southeast Alaska
The Problem SEAPROG (Dixon et al. 1992), a regional variant of FVS, is the primary vegetation simulator used in southeast Alaska.Over-prediction of stand density by SEAPROG has been confirmed recently in a systematic evaluation of the growth model by McClellan and Biles (2003).
The Problem (cont’d) The unreasonable projections made using SEAPROG appeared to be related to the estimates of maximum stand density (i.e., SDImax) used as defaults in the growth model.
Objectives of Present Study Determine Reineke’s (1933) maximum Stand Density Index (SDImax) for mixed spruce-hemlock stands in southeast AlaskaIdentify environmental and stand factors associated with the variability observed in SDImax
…a wise SAGE and his SECRET, R.I.P. S.D.I.
…terror-stricken Model Users, (documented by McClellan and Biles 2003)
…Heroes past, Wilbur Farr and Donald DeMars
…Heroes present, David Marshall and Michael McClellan
…their loyal Retainers, and Charles Peterson, Robert Deal,David Bassett, and Frances Biles
…a Post-Doc and an unruly Dataset. UnrulyDataset Post-Doc
The Setting: Southeast Alaska Area Harvested since 1950
Young-Growth Spruce-Hemlock Forest (age 30yr in 1968)
50 miles JUNEAU CooperativeStand-DensityStudy (CSDS)(Farr 1973) KETCHIKAN
CSDS Key Questions(Farr 1973) How will the growth of well-stocked, even-aged, hemlock-spruce stands of differing ages and productivity respond to thinning? How do stand density and species composition affect volume yields for given site-age combinations?
Planned Approach(Farr 1973) • Establish 192 permanent growth plots at 48 installations across the Tongass. • 3 site classes, 4 age classes, and 4 thinning levels (C, L, M, and H). • Each site and age class combination to be replicated 4 times.
Post-Thinning Dq and TPA 20 10 Quadratic Mean Diameter (in) Light Heavy 5 Medium 100 250 1000 Trees per Acre
Plot Layout • Initial design called for square, 0.2 acre plots• Dense control plots sampled with nine, fixed-radius, 0.004 acre subplots (0.036 acres total)
Periodic Measurements • Species and DBH on all live trees• Age, height, crown on subset of trees• Generally remeasured every 2-4 years• 7-15 periodic measurements per plot
A Large and Unruly Dataset UnrulyDataset Cannon Fodder
Present Study, Present Heroes David Marshall and Michael McClellan
Objective 1 of Present Study Determine Reineke’s (1933) maximum Stand Density Index (SDImax) for mixed spruce-hemlock stands in southeast Alaska
Hire a Post-Doc! Need you ask?
Size-Density Relationships Yoda et al. (1963)
-3/2 Power Self-Thinning Rule(Yoda et al. 1963) slope ≈-3/2 log( Mean Volume / Individual ) log( # of Individuals / Unit Area )
S D I Stand Density Index (SDI) Max. SDI Reineke (1933)
ln(Dq) = intercept +-0.62305*ln(TPA) Stand Density Index (SDI) 20 10 5 Quadratic Mean Diameter (in) 2 1 10 100 1000 10000 100000 Trees per Acre
Data from 40 Unthinned Plots • All plots undergoing self-thinning• >95% basal area spruce-hemlock• Initial stand ages from 13 to 94 years• 7-15 periodic measurements per plot• CSDS (31) and Taylor (9) plots
Estimation of SDImax Mean slope not significantly different than -0.62305 20.0 10.0 Quadratic Mean Diameter (in) 5.0 2.5 250 500 1000 2250 5000 10000 Trees per Acre
Estimation of SDImax Mean SDImax = 619.2 s.d. = 102.0, n = 40range = 441.9 to 839.1 20.0 10.0 Quadratic Mean Diameter (in) SDImax 5.0 mean 619.2 2.5 min 441.9 max 839.1 250 500 1000 2250 5000 10000 Trees per Acre
Objective 2 of Present Study Identify environmental and stand factors associated with the variability observed in SDImax
Environmental Factors • Plot slope (%) and aspect (Stage 1976)• Elevation• Latitude and longitude
Stand Factors • Total live basal area (BAT)• Spuce and hemlock proportions of BAT• Age and 50-year site index• Skewness of the DBH1.5 distribution (Sterba and Monserud 1993)
Stand Factors (cont’d) • Spatial variability of BAT for the dense control plots sampled with nine, fixed-radius, 0.004 ac subplots (0.036 ac/plot)
Results for Objective 2 None of the environmental or stand factors accounted for more than 30% of the variability observed in SDImax.
Results (cont’d) SDImax was significantly related to total basal area (+) and age (-) when both were included as explanatory variables in the same multiple linear regression model.(r2 = 0.5495, MSE = 4943.0864, p < 0.0001)
Results (cont’d) SDImax increased significantly as the spatial variability of total basal area (BAT) decreased.(r2 = 0.2850, MSE = 11739.0212, p < 0.0001)
Discussion Our estimated mean SDImax of 619.2 was similar to the adjusted default SDImax of 637.5 used in the growth model SEAPROG (85% of 750).
Comments from Gary Dixon • Process used to distribute mortality could be weighted too heavily toward the larger diameter trees.• Possible problem with input values which influence tree growth and therefore mortality (e.g., slope, aspect, elevation, site index, crown ratio, and tree height).
Comments from Gary Dixon (cont’d) • If the estimated growth is too low, then the estimated mortality at the end of a cycle will be too low.• If have too few measured tree heights and crown ratios, the relationships which “dub” in the missing values may need to be examined.
Discussion (cont’d) The 40 spruce-hemlock stands we investigated did not follow a commonself-thinning trajectory.Although the mean slope did not differ from Reineke’s slope, we observed a wide range in the slopes (and intercepts).
Discussion (cont’d) Similar to Johnson (2000), we found that model intercept was negatively and linearly associated with model slope.(r2 = 0.9420, MSE = 0.0101, p < 0.0001)
Discussion (cont’d) Therefore, our results support the statement by Turnblom et al. (various) that each stand has its own unique self-thinning trajectory.
Estimation of SDImax Mean Slope = -0.6036s.d. = 0.0606, n = 40range = -0.7635 to -0.4562 20.0 10.0 Quadratic Mean Diameter (in) 5.0 2.5 250 500 1000 2250 5000 10000 Trees per Acre
Estimation of SDImax SDImax = exp((intercept – ln(10)) / 0.62305) 20.0 10.0 Quadratic Mean Diameter (in) 5.0 2.5 250 500 1000 2250 5000 10000 Trees per Acre