Download
1 / 18
180 likes | 227 Views
Explore the processes influencing atmospheric saturation, such as cooling and vapor content increase, and learn about mixing, adiabatic cooling, and factors affecting cloud formation. Understand adiabatic cooling, dry and wet adiabatic rates, and atmospheric stability dynamics.

E N D
Review Lab 5 – Atm. Saturation • Relative humidity? • Mixing ratio / saturation mixing ratio? • Function of temp.. Clausius-Clapeyron curve • Sling psychrometer – what does this give us? • Dew point? • Looking at RH equation above, when temp is reduced, all else being equal, what happens to the RH of a sample of air? Does RH go up or down? • Air is saturated when RH=100%
Lab 6 • Lab 6: Saturation and Atmospheric Stability • processes that influence atmospheric saturation – i.e., cause cooling and/or increase in water vapor content • atmospheric processes that change either the temp and/or water vapor content of an air sample • In this lab, we’ll focus on atmospheric mixing and adiabatic cooling and some processes that drive these conditions
Saturation & Atmospheric Stability • Two main ways for air to reach saturation: • Cooling to its dew point temperature (most common) • Increasing water vapor content Remember Condensation produces: Fog Dew Clouds *ALL require saturated air to form! 1. 2. 3.
Atmospheric Mixing • When two air masses of different temps and water vapor content mix • When they mix, the new air mass will change in temp and water vapor • resulting in new mixing and saturation mixing ratios • Changes relative humidity
Assuming the two mixing air masses are the same size and you know the temps and RH find: • The new temp of mixed air mass • The new mixing ratio of the mixed air mass • From the above, you can find the new RH (due to change in temp and water vapor) Mixing Ratio = SMR * RH “Saturated air” 100% RH “Unsaturated air” 0 – 99.9% RH
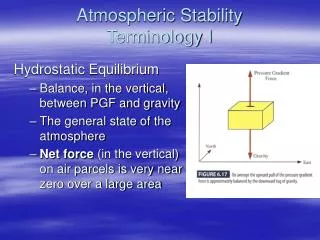
Adiabatic Cooling • Adiabatic temperature changes: • Temperature changes in which heat was neither added nor subtracted (closed system) • Average internal energy decreases with expansion – changes in average kinetic energy • Compressed air = warm air • Expanded air =cooler air • NOTE: If a parcel moves ↑, it passes through regions of successively lower pressure: • Ascending air: EXPANDS • Descending air: COMPRESSES
Saturation & Atmospheric Stability DRY adiabatic rate: unsaturated • cools at a constant rate of 10°C/1km of ascent • warms at constant rate of 10°C/km of descent WET adiabatic rate: saturated (has RH 100%) • Slower rate of cooling caused by the release of latent heat • Rates vary between 5°C & 9°C/1km • Amount of LH released depends on quantity of moisture in the air Dew Point rate: • 2°C/1km tothe LCL • At the WALR after the LCL LCL = altitude at which a parcel reaches saturation & cloud formation begins
Saturation & Atmospheric Stability DALR = 10°C/1km WALR = 5 – 9°C/1km WALR Air decreases by 2.5°C 10.5° LCL 13° 1.5 Air decreases by 5°C 18° DALR 23°
Lifting Condensation Level (LCL): • Reached when ascending air coolsto its dew point (saturation = 100% RH) – clouds form • If it continues to rise: • Cools at the wet adiabatic lapse rate (between 5°& 9°C) • Calculated based on: • Surface temperature & dew point temperature
Review • What is adiabatic cooling? • Wet versus dry • Thinking about atmospheric saturation, how does this influence cloud formation (hint: think about dew point temperature, etc.) • What is environmental lapse rate?
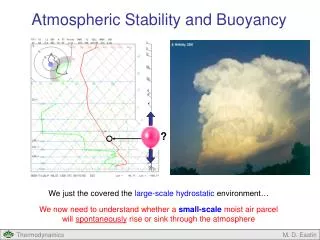
Atmospheric lifting forces: • Surface heating (air expansion, less dense, rise, etc..) • Two surface air masses colliding (convergence) • Contact of dissimilar air masses along warm & cold fronts (convergence) • Topographic barriers (e.g. orographic lift) • Upper air divergence • Rising air doesn’t mix substantially with the surrounding atmosphere. Once the initial lifting force stops, the continued rising of an air parcel depends on atmospheric stability (the state of the atmosphere surrounding the parcel).
Orographic Lifting • Air ascends: adiabatic cooling often generates clouds & lots of precipitation • Air descends: warms adiabatically, making condensation & precipitation less likely
Incorporating Dew Point LCL • Td (dew point) cools at: • 2°C/km belowthe LCL • The WALR above the LCL LCL – T(°C) – Td(°C)/8 25°C – 13°C = 12°C/8 = 1.5 km
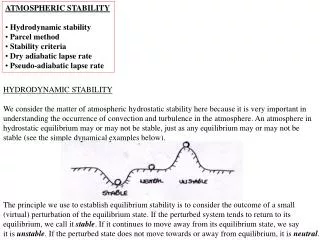
Absolute stability: • Environmental lapse rate is less than the wet adiabatic rate (surrounding air cools slower with height) • Stable air resists vertical movement, and doesn’t want to move. If it gets forced above LCL it would remain cooler and return to surface • Note: air parcel cools faster than ELR LAYERED CLOUDS not much vertical development
Absolute instability: • Environmental lapse rate is greater than the dry adiabatic rate (surrounding air cools faster w/ height) • Unstable air rises because of its buoyancy • Parcel of air cools slower than ELR VERTICAL CLOUDS potential for thunderstorms
Conditional stability: • Moist air has an environmental lapse rate between the dry & wet adiabatic rates