Download
1 / 32
320 likes | 327 Views
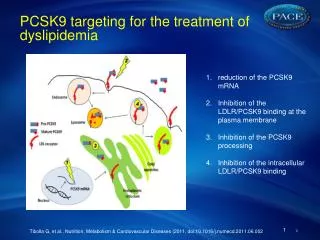
Pharmacoeconomic insight in current dyslipidemia treatment. Jana Skoupá, MD, MBA CARDIONALE Prague , 26.11.2010. Presentation outline. Epidemiology of CV diseases Role of health(pharmaco) economy in CVD Treatment costs and statin penetration

E N D
Pharmacoeconomic insight in current dyslipidemia treatment Jana Skoupá, MD, MBA CARDIONALE Prague, 26.11.2010
Presentation outline • Epidemiology of CV diseases • Role of health(pharmaco) economy in CVD • Treatment costs and statin penetration • Comparison of atorvastatin and rosuvastatin – the Czech model • Costs per LDL-C reduction • Costs per LDL-C target • Cost per CV-event risk reduction
CVD diseases mortality across Europe • Europe: 48 % of all death (4.3 Million) • EU-Europe (27 Member States): 42% (2 Mil) • CHD – Europe: one of five • 20% male - 22% female • Stroke – Europe: one of six to one of ten • 11% male – 17 % female
Unequal distribution Source: WHO 2004
Mortality decrease Comparison 2000/2002 to 1990/1991 Reduction by almost 50 %: UK, Ireland, Finland, Czech Reduction by 20 – 30 %: Majority of Europe Reduction by app. 10 %: Latvia (men), Poland (women) Source: Rayner M et al; Europ J of Cardiovascular Prevention and Rehabilitation 2009
CV morbidity • MONICA Project – most valid data set • Differences in incidence across Europe • Warsaw three times higher then Catalonia • Incidence CHD falling in most European regions, but… • Karelia – decrease per year by 6.5% • Increase in Kaunas (Lithuania) by 1.2% Source: Rayner M et al; Europ J of Cardiovascular Prevention and Rehabilitation 2009
CVD and DALY loss Source: Singh 2008 DALY = disability life years loss
Economic costs – EU in € Mil. Source: European Cardiovascular Disease Statistics (2008)
Health(pharmaco) - economy • Uses economic principles/concepts/theories and applies them to health-care • Solves the clash between limited resources and increasing/unmet demand/need VALUE OF INTERVENTION COSTS OUTCOMES =
Cost effectiveness – the 4th hurdle Budget-impact Cost-effectiveness Safety Efficacy Quality
PE outcomes in CVD • Cost effectiveness analyses (CEA): • Cost per life-year-gained (LYG) • Cost per event (MI, stroke) avoided • Cost utility analyses (CUA): • Cost per QALY (quality adjusted life-year) • Cost per year in perfect health • QALY integrates quantitative (life expectation) and qualitative (quality of life) factors into a single index (QALY)
Statines in PE focus • Perceived as „costly“ treatment • Despite significant price fall due to generics • Significant budget impact for payers • Large populations can/do profit from treatment • Cost/QALY (US market) • Secondary prevention: 5 000 USD/QALY • Primary prevention: 20 000 USD/QALY • Both below US WTP threshold
Statines CE • CE dependent on innitial risk level Source: Franco et al 2005
Statines CE Adaptability for our local markets ? Although costs per LYS in line with Czech estimates even for low risk. • CE dependent on innitial risk level Source: Franco et al 2005
% treated and annual growth Atorvastatin – leading molecule Simvastatin – leading molecule
Rosuva vs. atorva comparisonThe Czech model • Olsson AG: Rosuva vs. atorva over 52 weeks in patients with hypercholesterolemia • Different risk levels • Similar baseline characteristics • Doses: Rosuva 5 and 10 mg, Atorva 10 mg • Assessments - timing:W 2; W 12; W 52 • Goals of treatment: • % of lowering LDL-C • % of goal achievement Source: Olsson AG et al. Am HJ 2001
Treatment outcomes • Similar proportion of discontinuation in both groups • Similar safety profile in both groups * Goal NCEP ATP-II Source: Olsson AG et al. Am HJ 2001
Czech reimbursement model • Reimbursement: • Rosuvastatin 5 MG/tbl: 6,171 CZK • Rosuvastatin 10 MG/tbl: 8,23 CZK • Atorvastatin 10 MG/tbl: 6,171 CZK • CE per 1 % reduction of LDL-C (W12): • Costs per period/ % reduction • CE per LDL-C goal attainment (W52): • Costs per period/probability of goal attainment
CE outcomes Source: Adapted from Olsson AG et al. Am HJ 2001
Efficiency frontier % LDL-C reduction ROS 10 45 43 ATO 20 39 SIM 40 3 000 2 700 Annual costs Source: Adapted from Olsson AG et al. Am HJ 2001
Efficiency frontier % LDL-C reduction HIGHER EFFICACY LOWER/SAME COSTS ACCEPT INTERVENTION! ROS 10 45 43 ATO 20 39 SIM 40 3 000 2 700 Annual costs Source: Adapted from Olsson AG et al. Am HJ 2001
CV event risk reduction • CV event reduction – major CE outcome parameter • LDL-C reduction by 1 mg/dl reduces event risk by* • 0,16 % (Year 1) • Assuming that W12 LDL-C reduction is carried forward to W52 (Olsson) • Assumed costs for 52 weeks treatment (Olsson) Source: Adapted from Heart Protection Study
CZK per 1 % risk reduction Source: Adapted from Olsson (2002) and Bahia (2007)
CZK per 1 % risk reduction Rosuvastatin 10 = lowest costs per 1 % risk reduction! Source: Adapted from Olsson (2002) and Bahia (2007)
CE for goal attainment(Canadian Model based on efficacy from STELLAR) Goal based on Canadian guidelines Source: Adapted from Costa-Scharplatz et al. Clinical Therapeutics 2008
CE for goal attainment(Canadian Model based on efficacy from STELLAR) RosuvastatinDOMINANT if goal attainment is the relevant outcome! LDL-C goal seems to be the most appropriate parameter for statin treatment! Goal based on Canadian guidelines Source: Adapted from Costa-Scharplatz et al. Clinical Therapeutics 2008
Importance of goal attainment S-CARD project: 6 753 treated for mean of 8.8 months. Simvastatin 20 starting dose 90 Before treatment 80 After treatment 86 73 70 60 62 50 39 40 % patients at goal 39 30 28 20 7 10 2 0 Cholesterol LDL HDL TGL Source: S-CARD; Poster 420 at WONCA Ljubljana 2003
Summary and conclusions • Despite high CV morbidity and mortality • Low health-care expenditures vs. Western Europe • Lower but fast growing statin penetration • „Best in class“ therapy as standard (atorvastatin) • Generic rosuvastatin enables to furtheruplift treatment standards offering „best value for money“ (Czech Republic) • Costs per LDL-C reduction • Cost per patient at LDL goal • Cost per CV event avoided
Thank you for your attention! skoupa@pharmaprojects.cz