Download
1 / 35
350 likes | 371 Views
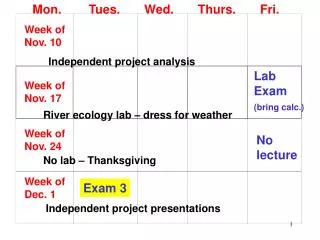
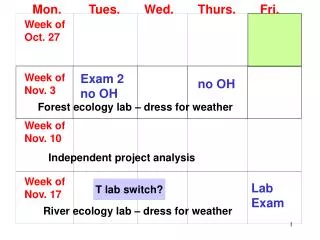
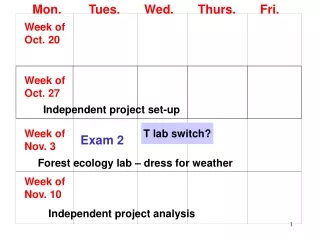
Mon. Tues. Wed. Thurs. Fri. Week of Oct. 20. Week of Oct. 27. Independent project set-up. T lab switch?. Week of Nov. 3. Exam 2. Forest ecology lab – dress for weather. Week of Nov. 10. Independent project analysis. What do we measure?

E N D
Mon. Tues. Wed. Thurs. Fri. Week of Oct. 20 Week of Oct. 27 Independent project set-up T lab switch? Week of Nov. 3 Exam 2 Forest ecology lab – dress for weather Week of Nov. 10 Independent project analysis
What do we measure? • Total population size = number of indivduals • How they are arranged in space • How many are in each age or size class
Figure 13.5 There is a simple statistical test to test for distribution Mechanisms?
What do we measure? • Total population size = number of indivduals • How they are arranged in space • How many are in each age or size class
Outline Introduction How are populations defined and measured? How do populations grow? How does population size change through time and space?
Growth = births – deaths + immigration – emigration When calculating growth rate, usually just seeing change in numbers over time
Populations grow by multiplication rather than by addition Just like interest in the bank
Exponential growth • new individuals are added (born) to population continuously • r = per capita growth rate = contribution of each individual in population
Exponential growth dN/dt = rN Rate at which individuals are added = growth rate on a per individual basis x population size = derivative of exponential equation = slope of line
Exponential vs. Geometric Growth Exponential – continuous reproduction - growth is smooth curve Geometric – discrete breeding seasons - calculate growth at discrete intervals
Geometric growth Growth rate = = population size at one time point/ size at previous time point N (t+1) = N(t) N(t) = N(0) t
Geometric growth: N(t) = N(0) t Exponential growth: N(t) = N(0) ert • = er Ln = r
Figure 14.5 Per capita growth rate = constant Rate of increase= dN/dt, increases with N Exponential
Age structure (# of individuals in each age class) of a population affects population growth Why??
Figure 14.8 Stable Fast growth
Age structure of a population affects population growth Life table = a summary by age of the survivorship and fecundity of individuals in a population Shows differences in birth and death rate for different parts of population
Stable age distribution – the proportion of individuals in various age classes in a population that has been growing at a constant rate - only happens if age-specific birth and death rates are constant over time - each age class grows at same rate
More common to see this pattern What’s going on?
Density dependence Lots of examples in book Common in nature Some factor that affects growth rate Some metric of population size
Density independence Very few examples in book Common in nature Some factor that affects growth rate Some metric of population size
Figure 14.27 Population Size
Logistic growth R changes as N changes such that r = ro(1-N/K) r = intrinsic growth rate at small N x the reduction in growth rate due to crowding K = carrying capacity of population
Logistic growth dN/dt = roN (1-N/K) Change in N with time = intrinsic growth rate at small N x population size x the reduction in growth rate due to crowding
If I give you an equation and a value for K and/or r or , I expect that you can sketch the graph. I expect that you will understand what the terms in the equations mean. I expect that you understand the assumptions of each model and the differences between them. I expect that you know what is in a life table and what parameters affect growth rate and what a life table can be used for.