Chapter 7 Production and Costs: Many Variable Inputs
330 likes | 349 Views
Chapter 7 Production and Costs: Many Variable Inputs. Isoquants and Input Substitution. An isoquant is a curve composed of all bundles that produce some fixed quantity of output. An example: y =(1200z 1 z 2 ) 1/2 Setting y =120 and simplifying gives 12= z 1 z 2 (see Figure 7.1).

Chapter 7 Production and Costs: Many Variable Inputs
E N D
Presentation Transcript
Isoquants and Input Substitution • An isoquant is a curve composed of all bundles that produce some fixed quantity of output. • An example: y=(1200z1z2)1/2 • Setting y =120 and simplifying gives 12=z1z2 • (see Figure 7.1).
Marginal Rate of Technical Substitution (MRTS) • The marginal rate of technical substitution (MRTS) measures the rate at which one input can be substituted for the other, with output remaining constant. • The MRTS is the absolute value of the slope of the isoquant.
Perfect Substitutes and Perfect Complements • Inputs are perfect substitutes when one output can always be substituted for the other on fixed terms and the MRTS is constant. • With perfect complements, substitution is impossible and the MRTS cannot be defined for the bundle at the kink in the isoquant.
Diminishing Rate of Technical Substitution • Most cases fall between perfect substitutes and perfect complements. In these cases, one input can be substituted for the other but the MRTS is not constant. • In such cases, it becomes increasingly difficult to substitute one input for the other. • This means the MRTS diminishes moving from left to right along the isoquant.
Figure 7.3 The marginal rate of technical substitution, MRTS
MRTS as a Ratio of Marginal Products • When the quantity of input 1 is decreased by Δz1, the change in y is (approx) the marginal product of the input times the change in the quantity of input 1. • Therefore: Δy=MP1Δyz1 • Similarly: Δy=MP2Δyz2
MRTS as a Ratio of Marginal Products • When z1 is very small, MRTS can be approximated by Δz2/Δz1 • Solving for z1 & z2 and substituting from above yields MRTS = (Δy/MP2)(Δy/MP1) • Reducing gives MRTS = MP1/MP2 • Therefore MRTS is equal to the marginal product of input 1 divided by the marginal product of input 2.
Returns to Scale • Increasing returns to scale occurs when increasing all inputs by X% increases output by more than X%. • Constant returns to scale occurs when an increase in all inputs of X% increases output by X%. • Decreasing returns to scale occurs when an increasing all inputs by X% increases output by less than X%.
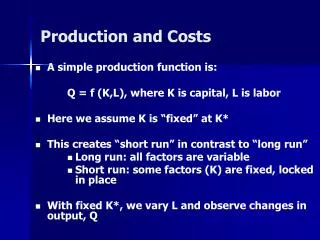
The Cost Minimization Problem: A Perspective • The cost function shows the minimum cost of producing any level of output in the long-run. • The long-run cost minimizing problem is: minimize w1z1+w2+z2 choosing z1 and z2 subject to constraint y=F(z1, z2)
Conditional Input Demand Functions • The solution to the cost minimization problem gives the values of the endogenous variables (z1* & z2*) as a function of the exogenous variables (y, w1 and w2). • Since z1* & z2* are dependent upon the level of ychosen, the input demand functions are described as conditional demand functions.
The Long-run Cost Function • Once we know the input demand functions, the long-run cost function is the sum of the input quantities and their respective prices. TC(y,w1,w2) = w1z1* +w2z2*
Solving Cost Minimization Problems • The isocost line shows all bundles of inputs that cost the same. It can be expressed as: c= w1z1+w2z2. • The absolute value of the slope of the isocost line is w1/w2. • This slope says that w1/w2of input 2 must be given up to get an additional unit of input 1. • The slope is the opportunity cost of input 1 in terms of input 2.
Principles of Cost Minimization • The cost minimizing input bundle is on the isoquant: y Ξ F(z1* +z2*). • The MRTS is equal to w1/w2 at the cost minimizing bundle: MRTS(z1*z2*) Ξ w1/w2 The second principle can be generalized by stating the marginal product per dollar must be identical for all inputs.
Comparative Statics for Input Prices • If all input prices change by the same factor of proportionality (a): • The cost of minimizing the input bundle for y units of output does not change. • The minimum cost of producing y units of output changes by the factor of proportionality (a).
From Figure 7.7 • If the cost-minimizing quantity of both inputs (i and j) is positive, and there is diminishing MRTS, if piincreases and pj does not, the cost minimizing quantity of i increases and j decreases. • If the price of an input increases and the quantity demanded of that input is positive, the minimum cost of producing any level of output rises.
Comparative Statics: Level of Output • The expansion path connects the cost minimizing bundles that are generated as output increases. • A normal input is one where the quantity demanded increases when output rises. • An inferior input is one where the quantity demanded decreases when output rises.
Homothetic Production Functions • A homothetic production function is a type of function where the expansion path is a ray through the origin. • For these types of functions the MRTS is constant along any ray from the origin.
Long-run Costs and Output • Long-run average costs (LAC) is equal to the total cost of output (TC) divided by the quantity of output (y): LAC(y)=TC(y)/y • As output rises, LAC is constant, decreasing, or increasing as there are constant, increasing, or decreasing returns to scale.
Long-run Marginal Cost • Long-run marginal cost (LMC) is the rate at which costs increase as output increases (the slope of TC). • When LMC lies below LAC, LAC is decreasing, when LMC exceeds LAC, LAC is rising, LMC intersects LAC at the LAC minimum.
Figure 7.13 Relationships between long-run and short-run cost functions
From Figure 7.14 • U-shaped cost curves reflect initial increasing and subsequent decreasing returns to scale. • If LAC attains its minimum at a relatively large level of output, we expect to see a monopoly or oligopoly. • If LAC attains its minimum at a relatively small level of output, we expect to see a competitive market.