Download
1 / 39
390 likes | 412 Views
Transform buildings into smart, efficient structures with visual analytics techniques. Use high-def line rendering, interactive bar charts, and parallel coordinate plots to analyze energy savings.

E N D
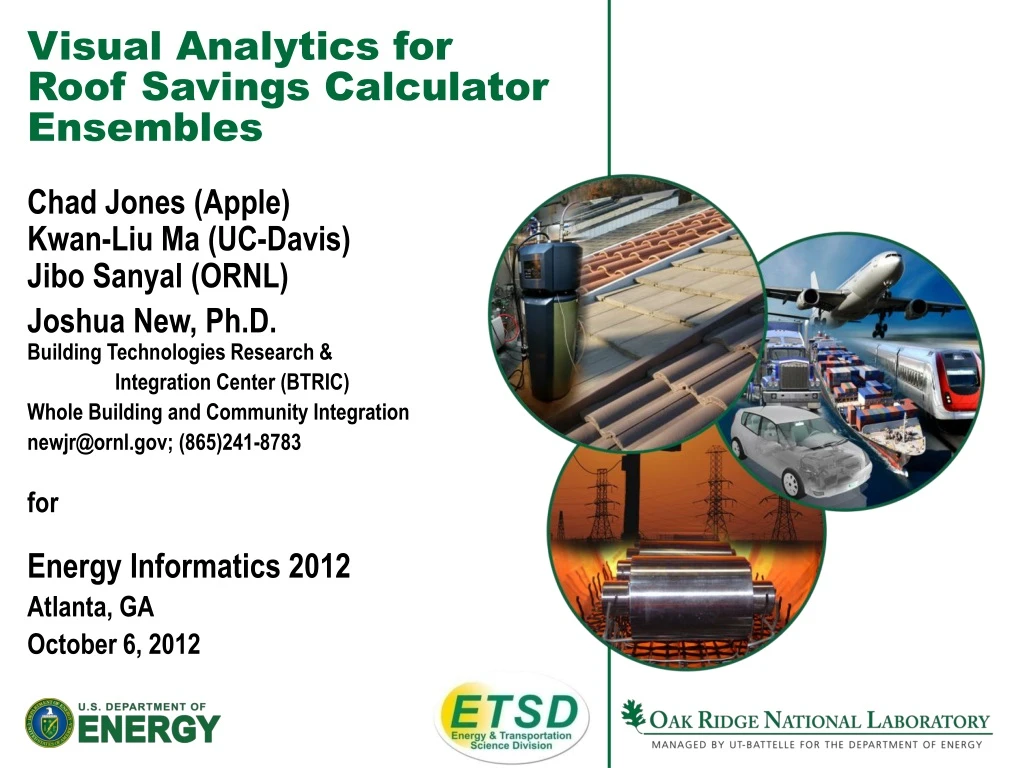
Visual Analytics forRoof Savings CalculatorEnsembles Chad Jones (Apple)Kwan-Liu Ma (UC-Davis)Jibo Sanyal (ORNL) Joshua New, Ph.D.Building Technologies Research & Integration Center (BTRIC) Whole Building and Community Integration newjr@ornl.gov; (865)241-8783 for Energy Informatics 2012 Atlanta, GA October 6, 2012
Science to transform today's buildings into smart, responsive, and efficient structures Experimental S&T Capabilities Modeling and Visualization R&D Better Buildings via Novel Tools and Technologies Building Science Data/Knowledge Materials Science Web-Based Tools Data/Knowledge Computational Science Automated Model Calibration Next Generation Commercial Buildings Neutron Science Industry CRADAs Data/Knowledge Innovative Products Sensors, Controls, Grid Next Generation Residential Buildings Data/Knowledge
Presentation Summary • Energy Context • Roof Savings Calculator • Visual Analytics Techniques • Cityscape • Maps • High-def line rendering • Interactive bar charts • Parallel Coordinate Plots (PCP) • Linked-view interaction
Presentation Summary • Energy Context • Roof Savings Calculator • Visual Analytics Techniques • Cityscape • Maps • High-def line rendering • Interactive bar charts • Parallel Coordinate Plots (PCP) • Linked-view interaction
Buildings use a lot of energy 1/3 of all energy and 2/3 of all electricity used in the US $220 billion in annual energy costs Source: US Department of Energy Figure 1. U.S. Primary energy consumption, 2006 Source: Building Energy Data Book, U.S. DOE, Prepared by D&R International, Ltd., September 2008.
Energy is the Defining Challenge of Our Time Buildings in U.S. 40% of primary energy/carbon, 73% of electricity, 34% of gas Buildings in China 60% of urban building floor space in 2030 has yet to be built Buildings in India 67% of all building floor space in 2030 has yet to be built Global energy consumptionwill increase 50% by 2030 • “Upgrading the energy efficiency of America’s buildings is one of the fastest, easiest, and cheapest ways to save money, cut down on harmful pollution, and create good jobs…” President Obama, December 2, 2011, while announcing Better Buildings Challenge
Presentation Summary • Energy Context • Roof Savings Calculator • Visual Analytics Techniques • Cityscape • Maps • High-def line rendering • Interactive bar charts • Parallel Coordinate Plots (PCP) • Linked-view interaction
Figure 2. Residential energy loads attributed to envelope and windows Source: Building Energy Data Book, U.S. DOE, Prepared by D&R International, Ltd., September 2008. Figure 3. Commercial energy loads attributed to envelope and windows Source: Building Energy Data Book, U.S. DOE, Prepared by D&R International, Ltd., September 2008.
Roof Savings Calculator Building Details HVAC efficiency and utility prices Roof and Attic Information(base vs. comp) Reports energy and cost savings DOE-2.1E+AtticSim CoolColors.lbl.gov RoofCalc.com 11
$/yr AtticSim DOE-2
RoofCalc.com Impact 24,100 web simulations, 156 users/feedback, 3+ million runs Average: 79 visitors/day 13
RoofCalc.com Redesign • Cathy Zoi feedback – more educational info • Google Maps for weather • More pictures and links to additional resources • Database for immediate recall of prior simulations • Interactive graphics and utility rates on results
CentiMark & FY13 • CentiMark’s CIO contacted ORNL • #2 in US roofing (but centralized) • 25.8% of the top 20 market • 2500 roof quotations per month • Installs 50+ million ft2 annually • FY13 Work • Software comparison (E+, DOE-2, Micropas) • Empirical validation (ORNL, TAMU) • RSC Update • Deployment
Presentation Summary • Energy Context • Roof Savings Calculator • Visual Analytics Techniques • Cityscape • Maps • High-def line rendering • Interactive bar charts • Parallel Coordinate Plots (PCP) • Linked-view interaction
Prior Projects Visual Analytics (PCP) Visualization of 3.5 million RSC simulations http://vis.cs.ucdavis.edu/~jonesc/PCP/ Web ServerPowerEdge R510 Visual Analytics (Computing) RoofCalc.com AI Models Nautilus Supercomputer Sensor Data Building Energy 18
Visual Analytics (demo) Visualization techniques (for Energy Simulation) City-Scape, Artificial Terrain DEMO 19
Climate Zone Map • Climate zones (1-8) shown on map.
High-Density Time Plots • Each line is the energy usage for a single simulation • Apply logarithmic coloring scaling to emphasis high traffic regions • Render outlier lines separately Context Focus
Category View • Bars for each category show occupancy levels • Grouped by dimension; highlighting & focus rendering Mouse Hover Highlight Categorical Context Categorical Focus
Parallel Coordinates • One parallel axis per data dimension;One line per data item crosses every axis Scatterplot vs. Parallel Coordinates Max Max X Y Y Min Max Min X
PCP Bin Rendering • Transfer Function Coloring: • Occupancy or Leading Axis
PCP Line Rendering • Can use coloring to denote amount of lines. • Example:
PCP Line Rendering • Advantages: • All data items are precisely represented • Best suited for numerical variables • Disadvantages: • Render time proportional to size of data • Suffers from overplotting • Not well suited for categorical data
Parallel Coordinates • Aggregate lines into 2D histogram bins between every pair of axes. 2D Histogram vs. Parallel Bins Max Max Y X Y Min Min Max X
PCP Binning • Bins can be rendered faster than lines • Can control accuracy of numerical axes by varying the histogram size • Provides more flexible rendering styles for categorical axes: • Category Stacking • Proportional Sizing
Parallel Coordinates Overview • Combined binning and parallel sets styles • Width-preserving curve rendering • Multi-threaded selection and bin updates • Category stacking with focus convergence • Transfer function coloring of occupancy or single variable
PCP Mixed Data Context Category-to-Category Category-to-Continuous Continuous-to-Continuous
PCP Mixed Data Focus Category-to-Category Category-to-Continuous Continuous-to-Continuous
Parameter Sweep Issues • Can use context to reveal missing portions of parameter sweep. • Potential Error: ‘Attic’ duct location only connects to three roofing types.
Outliers (Heating) • Selection of heating outliers • Find all are from Miami, have box building type, and heat pump
Image Fusion(based on cone-fusion of mammalian retina) Typical MRI and SPECT imagery Colorfuse Image
Full Results Learning Associations DEMO DetailResults