Download

1 / 28
280 likes | 590 Views
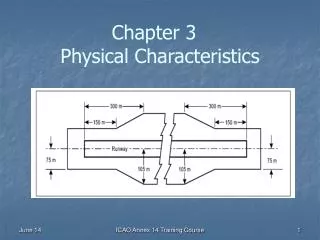
Chapter 9. Volume Studies & Characteristics. Chapter objectives: The student will be able to (we spend 2 lecture periods for this chapter):.

E N D
Chapter 9. Volume Studies & Characteristics Chapter objectives: The student will be able to (we spend 2 lecture periods for this chapter): • Understand that measured volumes may not be true demands if not careful in data collection and explain the relationships between volume, demand, and capacity • Explain typical temporal and spatial variations of volume (from your reading) • Set up a plan for continuous and coverage counts given a set of scheduling conditions • Explain the types of volume counts (control count, coverage count, etc) (from your reading) • Determine daily, weekly, monthly, and seasonal count adjustment factors Some of the topics in this chapter were covered in CEEn 361. Please review those topics by yourself. Chapter 9-4e
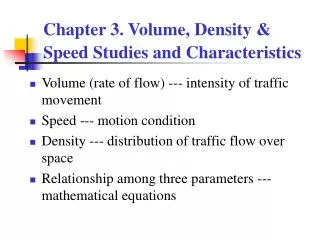
9.1 Critical Parameters There are four variables related to volume: Volume Rate of flow Demand Capacity Can you explain the differences among these volume-related variables? Chapter 9-4e
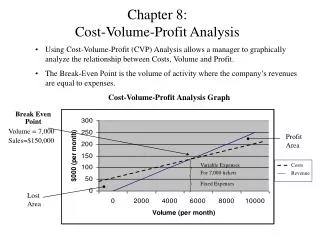
9.2 Volume, Demand, and Capacity Volume: The number of vehicles (or persons) passing the measurement point during a specified time interval. “What is” Rate of flow: The rate at which vehicles (or persons) pass a point during a specified time period less than one hour; expressed as an equivalent hourly rate. Demand: The number of vehicles waiting for service in the given time period, as distinct from the number that can be served. Capacity: The maximum number that can be expected to be served in the given time period. “What is possible” Upstream bottleneck capacity restrict the flow downstream. Depending on the situation, volume may not reflect demand. d = 3800+3600=7400>6000 Chapter 9-4e
Volume, Demand, Capacity (cont) May be mistaken as demand When capacity constraints exist upstream, demand cannot be measured downstream, because the discharge volume is NOT demand but bottleneck capacity volume. Chapter 9-4e
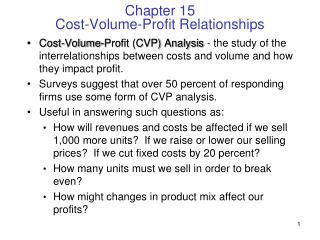
Fig 9.3 Effects of a bottleneck on observed volumes 3400x(500/3700) = 459 3400-459=2941 (Assume the proportion of off-ramp demand is the same for 3700 and 3400 vph. 2941x(400/3200) = 368 2941-368=2573 (3200 = 3700-500. Assume the proportion of off-ramp demand is again the same for 3200 and 2941.) Chapter 9-4e
9.3.1 Hourly Traffic Variation Patterns: the Peak Hour Chapter 9-4e
At I-15 Point of Mountain Chapter 9-4e
Fig 9.5: Peak Hour as a % of AADT K Factor Chapter 9-4e
9.3.2 Subhourly variation patterns: Flow rate vs. volume PHF = Hourly Vol/(4 * Volpeak 15) Chapter 9-4e Figure 9.6
9.3.3 Daily Variations Figure 9.7 Chapter 9-4e
9.3.4 Monthly or Seasonal Variations Chapter 9-4e Figure 9.8
9.4 Intersection Volume Studies 9.4.1 Arrival vs. departure volumes Usually discharge volume is counted at intersections. But when demand > capacity, queue is formed and discharge volume is never greater than the capacity. Hence, adjustments must be made to discharge counts to estimate demand. Counted at the beginning of each red phase at a signalized intersection: Why is this counted at the beginning of each red phase (interval)? For unsignalized intersections, the queue is counted at the end of each count period. Chapter 9-4e
9.4.2 Special Considerations for Signalized Intersections • Both the counting and the short-break periods must be equal multiples of the cycle length when you count at signalized intersections. See the example in the left column of page 176, Section 9.4.2. • If cycle length is 60 sec, 15 min counting (15 cycles) is good. For a 90-sec cycle length, 15 min (10 cycles) is again OK. For 120 sec cycle length, 16 min (8 cycles) is good. (Try prob. 9-3) Figure 9.9 Chapter 9-4e
9.5 Limited Network Volume Studies Small-network volume studies are intended to determine the amount and pattern of traffic flow over a limited network of street links and intersections during a specified interval. The extent of counting depends on resources -- money and manpower. Usually a sampling technique is used. Two types of counts are needed: Chapter 9-4e
Example of a small-network volume study:An 8-hr study from noon to 8 pm(pp. 179-184) 1 One-day (8-hr) study: Needs two crews: one at the control count station (8 hrs) and the other at coverage count stations (1 hr at each coverage station). 2 6 A Multi-day (6-day) study: Needs two crews: one at the control count station (8 hr/day, 6 days) and the other at coverage count stations (8 hr at each coverage station). 5 3 4 Combined (3-day) study: Needs two crews: one at the control count station (8/hr/day, 3 days) and the other at coverage count stations (4 hr at each coverage station, 2 stations per day). Control count STA Coverage count STA Chapter 9-4e
One-day Network Volume Study p.180. (Assume a similar peaking at all stations.) Peak Hour has 16.3% of the total 8-hour count. Chapter 9-4e
6-day Multiday Study Option, p.181-182 Fvi = Va/Vi Va = ViFvi Chapter 9-4e
Don’t seethis column. Tree-day Study Option, p.181 &183 Chapter 9-4e
Estimating Vehicle Miles of Traveled on a Network VMT values are used for many analyses, like crash rate determination and air pollution estimation. Chapter 9-4e
9.6 Statewide Counting Program • Some general principles for statewide programs are: • Objective: Conduct a coverage count every year on every 2-mile segment of the state highway system except low-volume (AADT<100 veh/day) roads. • Objective of coverage counts: Produce an annual estimate of AADT for each coverage location (then VMT) • One control-count location for every 20 to 50 coverage-count locations (stratified highway groups) • Control-count location can be either permanent counts or major or minor control counts. Control count stations count 24 hours 365 days to determine adjustment factors • All coverage counts are for a minimum period of 24-48 hours, eliminating the need to calibrate hourly variation patterns. Chapter 9-4e
UDOT’s permanent count stations. Chapter 9-4e
9.6.1 Calibrating Daily Variation Factors Chapter 9-4e
9.6.2 Calibrating Monthly Variation Factors From permanent count stations. Chapter 9-4e
Monthly Factor Calibrated from 12 Weeks of Data, Figure 9.14 (Note that this figure has nothing to do with the discussion for Table 9.8.) Chapter 9-4e
9.6.4 Using the Results AADT = 1,000 * 1.121 * 0.913 = 1,023 vehs/day Chapter 9-4e
9.7 Specialized counting studies (covered by CEEn565) OD count is discussed in detail in CEEn 565. Chapter 9-4e
8.7.1 Origin and destination counts (covered by CEEn565) • Conventional traffic origin and destination counts rely primarily on one of the three approaches: • License-place studies • Postcard studies • Interview studies If you have a lot of transponders uses for toll roads, you can automatically collect OD (on-ramp/off-ramp combinations). OD analyses need a lot of iterations. (Discuss the example in Figure 8.19 and Table 8-14.) Chapter 9-4e
8.7.2 Cordon counts (covered by CEEn565) Chapter 9-4e