Download
1 / 72
720 likes | 950 Views
Mixed Economies & Market Failure. All economies must answer 3 questions. What goods & services should be produced? How should the goods & services be produced? Who gets the goods & services that are produced?. Two extreme types of economies . communism or socialism

E N D
All economies must answer 3 questions. What goods & services should be produced? How should the goods & services be produced? Who gets the goods & services that are produced?
Two extreme types of economies communism or socialism capitalism
Who owns & controls the physical capital? In communism & socialism: the government In capitalism: private parties
How are resources allocated? In communism & socialism: through central planning & government administration. In capitalism: through contractual agreements between private parties.
In the real world, there are no purely communist or socialist economies and no purely capitalist economies. • All economies are mixtures.
Some sectors of all economies are privately owned and controlled and some sectors are owned and controlled by the government. • The extent of the mix differs from economy to economy.
Mixed Economies capitalistic or market economies communistic/socialistic or centrally-planned economies U.S., Canada, Australia, Japan, most of western Europe Sweden, India, Israel Russia, China, N. Korea, most of eastern Europe
Regardless of the type of economy, it is important to remember that people respond to economic incentives.
Example • In the former Soviet Union, managers producing window glass were rewarded by the number of pounds of glass they produced. What was the result? • Very thick glass. • They changed the reward system to be based on the quantity of glass as measured by the area. The result? • Ultra-thin glass. • Conclusion: People respond to incentives, so be careful what you reward.
Reasons Markets May Fail to Attain an Ideal Allocation of Resources • Lack of competition • Externalities • Public goods
Lack of Competition • Firms may collude to limit output and keep prices high.
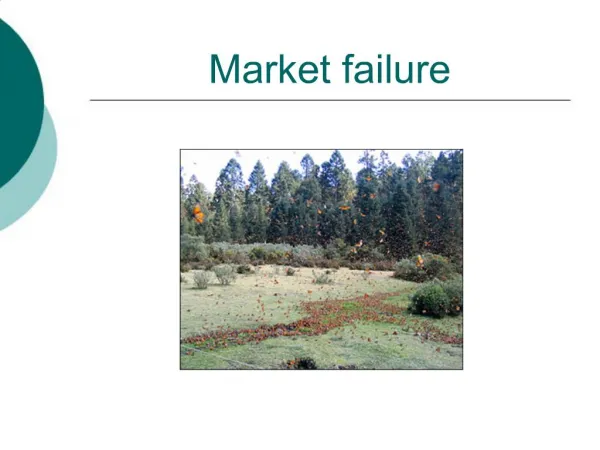
Externalities • Externalities are spillover effects. • Good externalities are external benefits. • Bad externalities are external costs.
External Benefits • benefits generated by the action of an individual or group that favorably influences the welfare of non-paying parties • example: gardens
External Costs • costs that result from an action of an individual or group that harms the welfare of non-consenting parties. • examples: litterbugs, drunk drivers, polluters
Social Benefits • social benefits = private benefits received by the decision-maker + any external benefits. • When there are no external benefits, private and social benefits are equal.
Social Costs • social costs = private costs incurred by the decision-maker + any external costs. • When there are no external costs, private and social costs are equal.
Example • project cost to a firm : $1500 • amount of aggravation to neighbors: $500 • What is the social cost? • social cost = private cost + external cost = 1500 + 500 = $2000.
Example continued • project cost to a firm : $1500 • project revenues to firm: $1800 • If the firm ignores the effects on the neighbors, will the firm undertake the project? • Yes, the firm will undertake the project, because • private benefits ($1800) exceed private costs (1500).
From the viewpoint of society, however, the project should not be undertaken. • recall: social cost = $2000 project revenues to firm = $1800 • social benefits = private benefits + external benefits = $1800 + $0 = $1800 • Since social costs > social benefits,the project should not be undertaken.
Coase Theorem • An acceptable solution to an externality will be found if • ownership of property is clearly defined, • the number of people involved is small, • the costs of bargaining are negligible.
In many situations, many people are affected and the costs of bargaining are substantial. • These types of problems are unlikely to be resolved appropriately without government intervention.
External Costs Supply - taking externality into consideration price Supply - ignoring externality P2 P1 Demand quantity Q2 Q1
Effects of External Costs • When an external cost is ignored, • the price is too low, and • the quantity is too high.
External Benefits price Supply Demand-taking externality into consideration P2 P1 Demand - ignoring externality quantity Q2 Q1
Effects of External Benefits • When an external benefit is ignored, • the price is too low, and • the quantity is too low.
Public Goods • Examples: • national defense • dams What are the characteristics of these goods that make them public goods?
Characteristics of Public Goods • Public goods are jointly consumed goods. If one person gets the good, everybody gets it. One person’s consumption of the good does not diminish the amount available for others to consume. • Also, the good can not divided up into separate portions for different individuals. Once a public good has been provided to one person, there is no easy way to prevent others from consuming it as well.
national defense - everyone is protected by the same defense system • dams - everyone in the community is protected from flooding by the dam
Why Public Goods Cause Problems in a Market Economy • There is an incentive to not reveal your true valuation, since if the good is provided, you are going to get the use of it anyway. • But if everyone refuses to reveal their true value of the good and so refused to voluntarily pay what it is worth, the good will not be provided. • This is where the government is useful. The government tells everybody what to pay and everybody has to do it. Then the government has the money to pay to have the good produced.
So far, we have discussed two major sectors of the economy. The first consists of for-profit businesses, and is the largest sector in the U.S. economy. The second sector is the government. We will examine now a third sector, which consists of nonprofit organizations.
The Nonprofit Sector • The term “nonprofit sector” describes institutions and organizations that are neither government nor for-profit businesses. • It is also sometimes called the third sector, the independent sector, the philanthropic sector, or the voluntary sector. • Outside the United States, nonprofits are often called nongovernmental organizations (NGOs).
What does nonprofit mean? • Nonprofit organizations are not forbidden to generate a profit, but if they make profits, these profits may not be distributed to owners or other private persons. • This nondistribution constraint is imposed on the organizations by the charter under which they are organized under state law.
Four Main Types of Nonprofit Organizations • Public Benefit Service and Action • Member-Serving • Religious • Funding Intermediaries
Public Benefit Service & Action • The missions of these organizations include providing health care, providing education, promoting the arts, and ensuring civil rights. • While organizations such as animal shelters are in this group, the largest of these organizations are usually hospitals and educational institutions.
Member-Serving • These nonprofits provide benefits to their own members. • Examples: professional organizations (such as the American Medical Association), labor unions, political parties, and social clubs.
Religious • Churches, Synagogues, Mosques, and related organizations.
Funding Intermediaries • These include charitable foundations (such as the Ford Foundation) and funding federations (such as the United Way).
How large is the nonprofit sector? • This sector includes about 1.6 million organizations, or more than 6% of all organizations of all types (nonprofit, for-profit business, & government) in the U.S.
We have established that while the market system works well, it is far from perfect. • The nonprofit sector represents one of the ways that the U.S. economy attempts to adjust for the imperfections. • Winston Churchill once made a statement about democracy. A similar statement can be said about the market system. Churchill said: • “Democracy is the worst form of government except all the others that have been tried.”
In a perfect world, no one would be hungry, cold, or homeless. • In addition, all incentives would operate in a fair and equitable manner. • In the real world, that is not the case. • That brings us to the subject of Poverty & Income Inequality
One way of examining income inequality is by looking at the shares of different quintiles of the population. • For example, what percent of all the income in the U.S. is in the hands of the poorest 20% of the population, and what percent is in the hands of the wealthiest 20%?
A graph of the cumulative income distribution is called the Lorenz Curve.
Graphing Income Distributions 1.00 0.80 0.60 0.40 0.20 0 Proportion of Income 0 0.20 0.40 0. 60 0.80 1.00 Proportion of Population
Perfect Equality Line 1.00 0.80 0.60 0.40 0.20 0 Perfect Equality Line Proportion of Income 0 0.20 0.40 0. 60 0.80 1.00 Proportion of Population
In the hypothetical situation of perfect inequality, one person has all the income, and everyone else has nothing.
Perfect Inequality 1.00 0.80 0.60 0.40 0.20 0 Proportion of Income Perfect Inequality 0 0.20 0.40 0. 60 0.80 1.00 Proportion of Population