Download

1 / 16
160 likes | 304 Views
Instructional materials summary – Harvard SI 2012 Title of teachable tidbit: ___Exponents Rule from Molecules to Ecosystems__. Exponents Rule from Molecules to Ecosystems. Group 2: Interface of Biology and Math Ed Luk , Gian c arlo La Camera, Liliana Dávalos – Stony Brook University

E N D
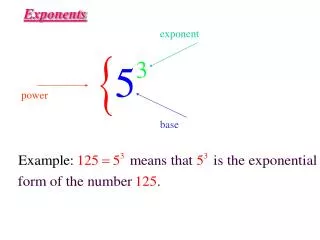
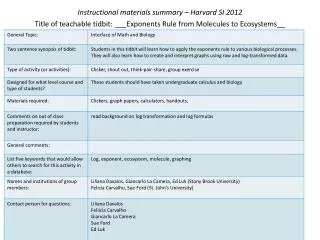
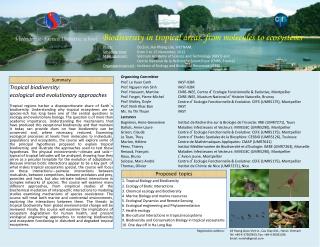
Instructional materials summary – Harvard SI 2012Title of teachable tidbit: ___Exponents Rule from Molecules to Ecosystems__
Exponents Rule from Molecules to Ecosystems Group 2: Interface of Biology and Math Ed Luk, Giancarlo La Camera, Liliana Dávalos – Stony Brook University Felicia Carvalho, Sue Ford – St. John’s University Facilitators: Xinnian Chen, Martin Samuels
Exponents Rule from Molecules to Ecosystems • Context and Audience: 2-week unit in a course forsophomore or juniors majoring in Biology, ~40 students • Background: 2 semesters of college math, introductory biology 1 and 2. Preceding units of the course cover linear, inverse relationships, and power relationships • Assumed knowledge: Students know mathematical formulas but cannot apply to real-world problems (Bloom’s levels 1 and 2) • Basic arithmetic • Have knowledge logarithms and antilogs • Know equations for straight line
Objectives / learning outcomes Students will be able to: • Justify the decision to log-transform data; • Create and interpret graphs using raw and log-transformed data.
How many butterfly species? 5000 square miles 100 butterfly species 2500 square miles How many butterfly species? The Florida Bugaboo Fire - Lake City, Fla., May 15, 2007 by Mark Wolfe/FEMA http://www.photolibrary.fema.gov/photodata/original/29930.jpg Train route Goa forest by Mohan P. http://www.publicdomainpictures.net/pictures/10000/velka/417-221153452NXrX.jpg
Think-pair-share Question: 5000-square mile forest has 100 butterfly species; how many species in 2500- square mile remnant? • Think for a moment about how many species there will be • Talk with your neighbor for one minute about what you think • Share with the class
How many species in 2500 miles2? • About 25 • About 50 • About 75 • About 90 • I cannot tell how many species there will be
How did that work? • Logarithmic transformation used to rescale the x or y values, or both • This transformation has converted the data to a linear equation y = mx +b
Handouts • Groups 1&3 take dataset 1 • Groups 2&4 take dataset 2 • Groups 5&6 take dataset 3 • For your dataset: • Which data would you transform, X or Y? • Why did you choose that axis? • Plot 4 data points using your log transformed data on the graph paper provided to you.