Download
1 / 33
330 likes | 346 Views
This article discusses the state of transportation funding in Kentucky, including statistics, recent legislation, and alternative funding approaches. It also explores the impact of federal actions and various sources of state funding.

E N D
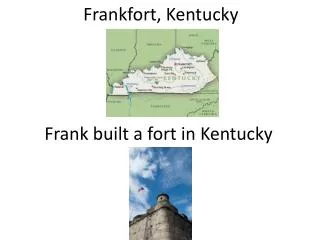
Working Group on Kentucky’s Transportation InfrastructureKevin PulaSenior Policy Specialist - TransportationNational Conference of State Legislatures Frankfort, KY| September 7, 2017
National Conference of State Legislatures • Non-profit, bi-partisan organization • Members are all 50 state legislatures, 7,383 legislators and 30,000 legislative staff in 50 states, D.C. and U.S. territories. • Offices in Denver and D.C. • Among our goals - To provide legislatures with information and research about policy issues, both state and federal. • NCSL tracks state policy developments in all public policy areas including transportation funding & finance, traffic safety and public transportation.
Overview • State Transportation Funding Statistics & Trends • Recent Federal Action • State Reliance on Motor Fuel Taxes • Recent State Legislation Increasing Transportation Funding • Other Transportation Funding Approaches Utilized by States
How are Revenues Being Spent? ***56% of transportation spending is on new capacity***
The 2015 FAST Act • $305 billion, 5-yearreauthorization • 5% increase; growing to15% for Highways • 8% increase; growing to18% for Transit • No New User-BasedRevenues for HTF • $70 billion in “pay-fors” • $53.3 B from Federal Reserve Surplus Account • $6.9 B in reduced Federal Reserve Stock dividend payments • $6.2 B from sale of Strategic Petroleum Reserve
Changes to Federal Programs • Surface Transportation Block Grant Program • $2 B increase • Percentage split adj. • Transportation Infrastructure Financing and Investment Act • Lowered project size requirements • Increased share going to rural projects • Funding Alternatives Grants • $95 million in competitive grants • Mileage-based user fee pilots
Sources of State Funding • 2016 Transportation Governance and Finance Report • Found50+ funding mechanismsfor transportation
Decreasing Value of State Gas Taxes • Motor fuel tax revenues account for 1.6 percent (2011) of total state and local general revenues. Down from 2.3 percent in 1993. • Small increases have lagged behind growing funding needs. Sources: Tax Policy Center, 2014; ITEP, 2015; NCSL, 2014
19 states have not raised their gas tax in more than a decade. • 13 states have not raised their gas tax in over 20 years.
Impact of CAFE Standards • 54.5 mpg goal by 2025 • The impact will increase significantly • 67 % mpg increase in 20 years
Gas Tax Increases • 26 States & D.C. have enacted legislation since 2013 • No strong demographic, regional or political trends __ = Republican __ = Democrat __ = Split Legislature
Variable vs. Fixed Taxes • 20 states, representing 57% of population, now index their state MFT
Electric Vehicle Fees • Georgia and W. Virginia are highest in nation at $200 • ID, IN, MI, OK and WV impose fees on Hybrids as well
18th highest Registration & Weight Fee ($2,126) • 8th highest diesel tax • 3rd highest total tax/fees on trucks
Weight-Distance Taxes • KY – 2.85 cpm • NM – 4.378 cpm • NY – 3.9 cpm • OR – 13.16 cpm *cpm – cents per mile • Ranked 1 to 4 in country for total charges to large trucks
Pay per Mile? • OreGo Pilot Turns 1 in July • 5,000 volunteers; largest pilot to date • California Road Charge Pilot • 9-month pilot starting Summer 2016 • Washington • Steering Committee to study feasibility of RUC program • Illinois • Senate President Cullerton – SB 3267 (postponed) • FAST Act – §6020 offers $95 million in competitive grants. • US DOT supported various other small pilots.
Federal Grants • $14.2 million awarded in 2015 • 8 programs funded • Testing a variety of approaches
Transportation Ballot Measures • November 2016 • IL – Constitutional Lockbox • ME – $100 million in bonds • NJ – Constitutional Lockbox • NV – Index local fuel taxes to inflation • 2015 • LA – Created a State Infrastructure Bank • ME – $85 million bond package • MI – Large-scale transportation package (failed) • TX –$2.5 billion GF transfer to transportation
NCSL’s Transportation Funding Deep Dive Gas Tax Legislation What’s New National Overview Transportation Funding Options Transportation Funding by the Numbers http://www.ncsl.org/bookstore/state-legislatures-magazine/deep-dive-transportation-funding.aspx
Strong States, Strong Nation Kevin Pula Senior Policy Specialist NCSL Transportation Program Direct line: 303-856-1373 kevin.pula@ncsl.org