Download

1 / 13
130 likes | 246 Views
Anoxia in Narragansett Bay Can we predict it?. Narragansett Bay Fixed-Site Water Quality Monitoring Network. Agencies: RIDEM-OWR, URI/GSO, NBNERR, NBC, NBNEP, & RWU Site Locations: West Passage, East Passage, Providence River, Seekonk River, West Greenwich Bay, & Mt. Hope Bay

E N D
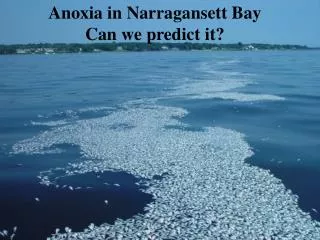
Anoxia in Narragansett Bay Can we predict it?
Narragansett Bay Fixed-Site Water Quality Monitoring Network • Agencies:RIDEM-OWR, URI/GSO, NBNERR, NBC, NBNEP, & RWU • Site Locations:West Passage, East Passage, Providence River, Seekonk River, West Greenwich Bay, & Mt. Hope Bay • Funding: NOAA Bay Window Program, EPA Clean Water Act (sections 319 & 106), & NOAA National Estuary Program
Hypoxia Study Program Goals • Predictive/modeling tools for decision makers • Models that predict susceptibility to hypoxia • Integrated parameterizations • Transferability of results across systems • Data to calibrate and verify models
Our approaches • Hybrid Ecological-HydrodynamicModeling • Ecological model:simple • Few processes, few parameters • Parameters that can be constrained by measurements • Few spatial domains (~20), as appropriate to measurements available • Net exchanges between spatial domains: from hydrodynamic model • Hydrodynamic model:full physics and forcing of ROMS • realistic configuration; forced by observed winds, rivers, tides, surface fluxes • Applied across entire Bay, and beyond, at high resolution • Passive tracers used to determine net exchanges between larger domains of ecological model • Empirical-Statistical Modeling • Input-output relations, emphasis on empirical fit more than mechanisms • Development of indices for stratification, hypoxia susceptibility • Learn from hindcasts, ultimately apply toward forecasting
Phytoplankton O D 2 N P An alternative approach? 4 state variables, 5 processes Processes of the model & basis for formulations: Temp, Light, Boundary Conditions Chl, N, P, Salinity O2 coupled stoichiometrically Productivity Physics Surface layer - - - - - - - - - Deep layer - - - - - - - - - Bottom sediment BZI mixing flushing Atmospheric Photic zone heterotrophy Flux to bottom deposition . ƒ[Chl] N ƒ(Chl10d) Sediment Land-use organics Benthic heterotrophy N P Denitri- fication ƒ(OM,T) % .
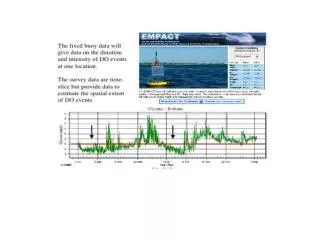
Field Work in Support of Ecological Models Historical Hypoxia based on benthic forams Water Column Metabolism Sediment Oxygen Demand Denitrification Rates Oxygen Surveys ( some with other funding) Survey of nutrient concentrations
Accomplishments Physical model running. Ecological model started. Input output model started. One year of denitrification measurements. Historical foram survey completed. Half a year of metabolism measurements. Physical measurements made in the upper bay: currents upper east and west passages. water column profiling. neap tide studies. Intensive oxygen surveys conducted for two summers. Workshop conducted with environmental mangers.