Download

1 / 22
220 likes | 275 Views
Explore the competitive ratios and properties of First-Fit algorithm in coloring intervals for resource allocation in interval graphs. Analyze the lower bound on the clique size using column construction.

E N D
An Analysis of First-Fit N.S. Narayanaswamy (IITM) Work with R. Subhash Babu
5 4 3 1 2 1 2 3 4 5 Interval Graphs Clique number ω: The maximum no. of intervals that share a point.
5 4 3 1 2 Coloring Intervals color time • Resource Allocation: • Each interval ~ Request for a resource • for a period of time • Color ~ Resource
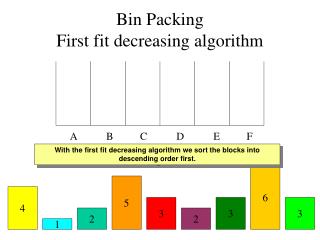
Coloring • Offline coloring • Optimal coloring : Consider intervals in non-decreasing order of their left end points, assign the least feasible color. • chromatic number = clique number • Online Coloring • Requests/intervals are presented in a sequences one after another. Example
Competitive Ratio of First-Fit No of colors used by the online A Competitive Ratio of A max G,s = No of colors used by the optimal offline algorithm No of colors used by First-Fit max G,s = ω
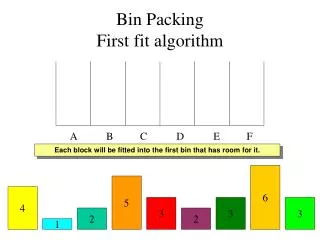
First fit • Principle: Assign the least feasible color to the incoming interval. • Currently proved to use at most 8ω-3 colors (our work). • First 8ω by Kierstead, Brightwell, Trotter improving 10ω by Pemmaraju, Raman, Varadarajan. • There exists an instance on which First fit uses at least 4.4ω colors.
First fit: Example • Clique size is 2, therefore offline uses 2. • No of colors used is 4
Properties of First fit • Property: If an interval I is colored j, then there exists an interval I’ in each color i, 1 ≤ i ≤ j such that I intersects I’. • Wall like structure, height=number of colors used
Analysis of First-Fit • Goal : Find a lower bound on the clique size in terms of the height of the wall. • Column construction procedure : a counting technique • Idea • Consider the First-Fit wall as a grid. • Assign one of three symbols to each cell in the grid. • Count relative occurrences of symbols. • Lower bound the clique size
Column Construction Procedure m C4 C3 C2 C1 • Elementary Columns/Intervals • Assign symbols to each cell – R, $, F ( ,, ) • Find relations between ,and to find a lower bound on the clique number.
Column Construction C4 C3 C2 C1 R R R R R R R R R • First Step: Consider C1 = set of cells colored 1, they get the label R. • Ending Condition: For i = 2,3,… stop when Ci obtained from Ci-1 becomes empty.
R R R R Rule - R C4 C3 C2 C1 R R R R R R R R R R1: For each cell e in Ci-1, if e is occupied by an interval I colored i, then add e to Ci with the symbol R.
$ R R $ $ R R $ Rule - $ C4 C3 C2 C1 R R R R R R R R R R2: For each remaining cell e є Ci-1, if e has a neighbor e’ in Ci-1which is added to Ci by rule R1, then add e to Ci with the symbol $.
Rule - F i-1 j j el er e R3 : For each remaining cell e in Ci-1 , if e has a neighbor e' in Ci-1 and e' is neighbor of e down to the level j, and e(j , i) > (i - j)/, then add e to Ci with the label “F”. All other columns become inactive Rules are applied in the order R1, R2 and R3.
$ R R $ $ R R $ Final Picture m’ F F F F F F F F F $ R $ R $ F C4 F $ R R R $ F F F C3 F C2 C1 R R R R R R R R R
Analysis of the Height • m ≤ m’. • For each i ≤ j, an interval colored j intersects Ci • For 1 ≤ i ≤ m’ and e єCi , e(i) ≥ (m - e (i)) / • Proof by induction on i • e (m') ≤ 2m'/ • m’ crucial here. Without this there was a weaker upper bound, and hence 10 competitiveness.
Proof Outline i1 j1 j2 i2 j3 i3 j4 e e (m') ≤ 2m'/ ⇒ e(m') + e(m') ≥ m' – 2m'/ ⇒ e(m') ≥ m'/(1 -2/) ⇒ e(m) ≥ m/(1 - 2/) ⇒ e(m) ≥ m/8, for =4
New Observations • C1 needs only to be cells corresponding to a minimal clique cover of the underlying interval graph. • Analysis works by changing the order of rules to R1, R3, and R2. This yields a nicer proof of • For 1 ≤ i ≤ m’ and e єCi , e(i) ≥ (m - e (i)) / Thank You
Online Vs Offline Offline: 3 2 4 1 Online: (1,3,2,4) [First fit] 4 2 3 1 Back
1-Wall: Examples 1-wall Back
2-Wall: Examples 2-wall Back
3-Wall: Examples 3-wall Back