Download
1 / 13
130 likes | 289 Views
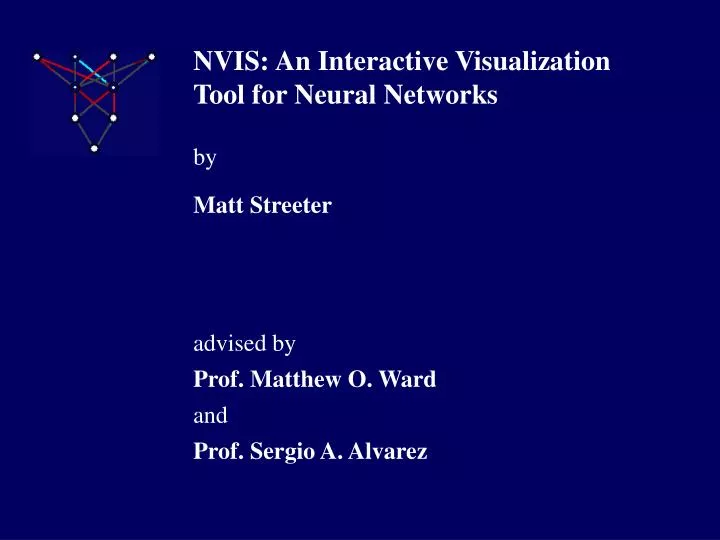
NVIS: An Interactive Visualization Tool for Neural Networks. by. Matt Streeter. advised by. Prof. Matthew O. Ward. and. Prof. Sergio A. Alvarez. What is a Neural Network?. Weighted, directed graph, organized into layers.

E N D
NVIS: An Interactive Visualization Tool for Neural Networks by Matt Streeter advised by Prof. Matthew O. Ward and Prof. Sergio A. Alvarez
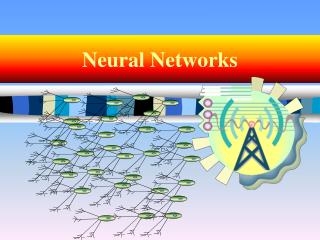
What is a Neural Network? • Weighted, directed graph, organized into layers • Set of neurons (nodes) and synapses (edges), with signals transmitted between neurons via synapses • Valuable tool for pattern recognition and function approximation
Why create a visualization tool for neural networks? • Understand how neural networks work, gain insight into problem being solved • Understand how genetic algorithm evolves networks • Other tools exist, but do not show neuron activations or genealogical relationships
Feedforward network visualization • Synapse strength represented by length and brightness of colored bars (linear scale). Blue lines indicate positive weights; red lines indicate negative • Diameter of white circles represents neuron’s output or activation • Each weight acts as a slider
Compact matrix representation • Purpose is to allow many networks to be displayed on the screen at once • One matrix for each level of weights • Row x, column y of matrix n represents weight from node y of layer n to node x of layer n+1 (same colors)
Generations & family trees • Row of compact matrix for each generation, ordered by fitness • User can select any network in the population history • Separate window shows family tree of selected network
Interactive environment • Set evolution strategy, network architecture, and training set • Graph representation and family tree available for any network in population history • Load/save networks • Real-time fitness graph
Designing networks • By dragging weights, user can design a network to solve a problem, or refine a network that has already been trained • Real-time display of fitness score; easy to see importance of particular weight • Not a practical way to find a network to solve a problem
Understanding genetic drift • Genetic drift is tendency for members of artificial populations to all be alike • Initial diversity in generations 0-2, rapidly lost in generations 3-5 • Best (leftmost) network in generation 3 is parent of best network in generation 4, grandparent of best 8 in generation 5, and ancestor of all later networks (not shown)
Changing weights & local optima • Error backpropagation algorithm performs gradient-based search (local optimum) • Weight dragged while backprop is running will either “snap back” to original optimum, or all weights will shift to new optimum • Can estimate the length of a local optimum with respect to each axis in weight-space
Extracting domain knowledge • Positive weights in all but first layer; effect of input nodes therefore directly related to incident weights • Higher crime rates (C) tend to reduce value of house; higher number of rooms (R) tends to increase value • Analysis could be applied to problem domains where no a priori knowledge exists
Future work • Graph representation does not scale well • Implement a variety of evolutionary algorithms (breeding & selection schemes) • Depict network architectures other than feedforward • User evaluation
For more information . . . • Visit http://www.wpi.edu/~mjs/mqp • See technical report WPI-CS-TR-00-11, available at: http://www.cs.wpi.edu/Resources/techreports/index.html Questions?