Download
1 / 27
270 likes | 369 Views
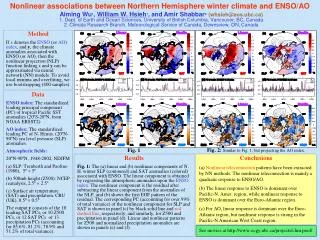
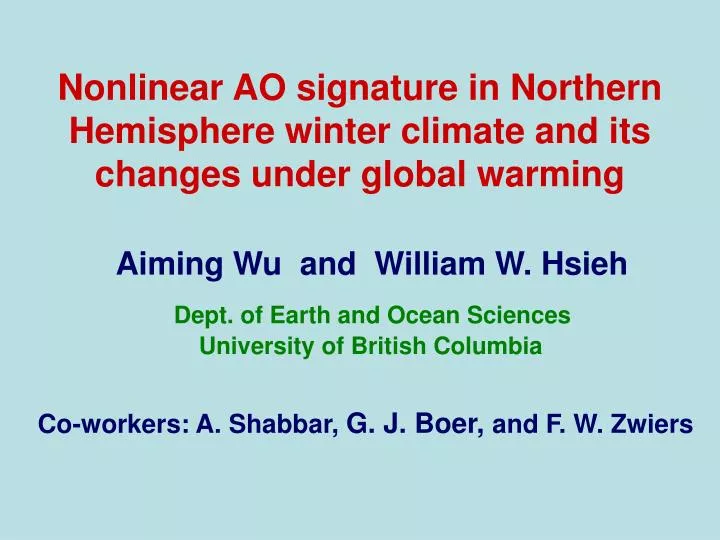
Nonlinear AO signature in Northern Hemisphere winter climate and its changes under global warming. Aiming Wu and William W. Hsieh. Dept. of Earth and Ocean Sciences. University of British Columbia. Co-workers: A. Shabbar, G. J. Boer, and F. W. Zwiers. Outline. Methodology and Data

E N D
Nonlinear AO signature in Northern Hemisphere winter climate and its changes under global warming Aiming Wu and William W. Hsieh Dept. of Earth and Ocean Sciences University of British Columbia Co-workers: A. Shabbar, G. J. Boer, and F. W. Zwiers
Outline • Methodology and Data • Nonlinear association between AO and N. Hemis. winter climate (a) observation(1948-2002) (b) CCCma CGCM2 • Changes of AO behavior under global warming (a) observation(1901-1950vs.1951-2000) (b) CCCma CGCM2 201-yr(“IS92a” forcing scenario) • Conclusions
Background (a)Composites of atmos. anomalies during high and low AO index months showasymmetricspatial patternsnonlinearassociation between AO and climate fields (b)Linear regressiononly gives strictlysymmetricpatterns for opposite phases of AO We come to a nonlinear regression or projection ……
Nonlinear projection via NN h = tanh (Wx • x + bx) y = Wh• h + bh Output layer Hidden neurons AO index y = f(x) As x varies, both amplitude and spatial pattern of ychange LP: amplitude changes, spatial pattern fixed
Observational Data • Sea level pressure (SLP, 5º 5º, NCAR, 20ºN~90ºN) AO indexThe standardized leading principal component (PC) of winter (NDJFM) SLP anomalies • 500mb geo-potential height (Z500, 2.5º 2.5º, NCEP reanalysis, 20ºN~90ºN) • Land surface air temperature (SAT) and precipitation (PRCP), from CRU-UEA (UK), 0.5º 0.5º • Monthly, 1948-2002, winter season (NDJFM) • Data compressed by PCA, with10 SLP, 10 Z500, 12 SATand12 PRCPPCs retained (to train NN model)
Model Data CCCma CGCM2 201-yr simulation (1900-2100) • with “IS92a” forcing scenario • 3 ensemble members • anomalies based on 30-year running climatology(to remove the long-term trend) • 4 periods (each 50 5 3 = 750 winter months) P1: 1901-1950 P2: 1951-2000 P3: 2001-2050 P4: 2051-2100 • NN projection ofmodel AO indexontomodel SLP,Z500, etc, andfor each period, separately
Observational results (based on 1948-2002)
Linear regression NLP = Linear part + Nonlinear part PCA (Over 99% variance by mode 1)
PC1 of nonlinear component & AO index y = -0.743 -0.172x+ 0.763x2 + 0.018x3 – 0.007x4 – 0.001x5
(a) (b) (c)
CCCma CGCM2 results (P2: 1951-2000)
Model P2 H H L L H L H SLP OBS 1948-02 H H L L H L L H
Model P2 H H L H L L L H Z500 OBS 1948-02 H H H L H L L L H
Changes under global warming (compare P1, P2,P3, P4)
CGCM2 Linear H H L L H H SLP H H L L H H
Linear CGCM2 H H L L H H Z500 H H L L H H
Nonlin. CGCM2 H L H H L L L SLP H H L L H H L L
Nonlin. CGCM2 H H L L L L Z500 H H H L L H L L
1901-1950 1951-2000 H L H L L H L L OBS. SLP (Nonlinear)
(b) (a) CGCM2 H L H L L SLP (d) (c) H L L H H L L
(b) (a) CGCM2 H H H L L H L Z500 (c) (d) H H H H L L L
Feedback of the nonlinear component to the linear component ? As With a small change in mean state, We assume then
Conclusions • NLP extracts nonlinear (mainly quadratic) association btw. AO and N. H. winter climate, which is dominant over the Pacific- N. Amer. West Coast(while linear component is dominant over Euro-Atlantic) • The observed nonlinear AO behavior and its changes under global warming are well simulated by CCCma CGCM2 • The shift of the nonlinear AO teleconnection towards the Pacific seems to be linked to global warming • Under global warming, nonlinear componentmay affect linear component