Download
1 / 23
240 likes | 567 Views
Real-Time Measurement of Granule Densification and Size in High Shear Wet Granulation: Combined Use of Focused Beam Reflectance Measurement with Drag Force Sensor. Ajit S. Narang 1 , Brian Breza 1 , Kevin Macias 1 , Tim Stevens 1 , Divyakant Desai 1 , Sherif Badawy 1 , Dilbir Bindra 1,

E N D
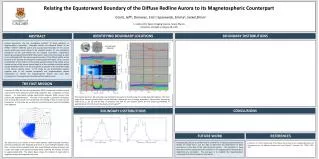
Real-Time Measurement of Granule Densification and Size in High Shear Wet Granulation: Combined Use of Focused Beam Reflectance Measurement with Drag Force Sensor Ajit S. Narang1, Brian Breza1, Kevin Macias1, Tim Stevens1, Divyakant Desai1, Sherif Badawy1, Dilbir Bindra1, 1Bristol-Myers Squibb, Co., New Brunswick, NJ Vadim Stepaniuk2, Valery Sheverev22Lenterra, Inc., Newark, NJ AAPS 2013
Purpose • Process analytical technologies (PAT) for real time monitoring and control of high shear wet granulation (HSWG) have achieved significant success in granule size distribution using focused beam reflectance measurement (FBRM). • However, granule densification is an important quality attribute that often correlates with granule porosity and drug product dissolution. • PAT tool to quantify granule densification, in parallel with size distribution, can provide complete attribute-control for the granulation processes, enabling building quality-by-design in the HSWG unit operation. • In this study, the resolution and sensitivity of a drag force flow (DFF) sensor in delineating granulation densification used concurrently with FBRM C35 probe was investigated.
Methods • A placebo formulation consisting of microcrystalline cellulose, lactose monohydrate, croscarmellose sodium, and hydroxypropyl cellulose (HPC) was granulated with 40% w/w water in a 30 liter Pharma Connect granulator at impeller tip speed of 4.8 m/s and chopper speed of 1000 rpm. • Rate of granule size growth and densification were measured using in-line FBRM C35 probe and DFF sensor at different concentrations of HPC (1%, 3%, and 5% w/w).
Shear Sensor • Product of Lenterra Inc. • Drag force on thin cylinder shear force • Minute deflections of the hollow pillar are detected by two optical strain gauges (Fiber Bragg Gratings) attached on the inner surface of the pillar • Force and temperature measured • No moving parts, no gaps where particles could be trapped • Measurement speed 500 Hz • Force as low as 1 mN can be detected Drag Force Flow (DFF) Sensor Base Optical strain gauges Hollow pillar Optical fibers
Placement of Sensors in the High Shear Granulator DFF Sensor DFF Sensor C35 Probe • Focused beam reflectance measurement (FBRM) C35 probe for in-line measurement of chord length distribution (CLD). • DFF sensor for shear measurement.
Experimental Conditions • Batches: • Test 1- HPC 1%; Test 2- HPC 3% ; Test 2- HPC 5%. • Blade RPM: 210 (4.8 m/s), chopper RPM: 1000 • Timing: • Test 1: Impeller starts – 9 s, water on- 259 s, water off- 439 s, impeller stops- 1370 s. • Test 2: Impeller starts – 10 s, water on – 250 s, water off – 432 s, impeller stops – 1333 s • Test 3: Impeller starts – 24 s, water on – 267 s, water off – 447 s, impeller stops – 1368 s • DFF Sensor • Position: 1” above the blade. • Acquisition rate: 500 Samples per second • Color convention on the plots: • Test #1 – red curve • Test #2 – green curve • Test #3 - blue curve • Light blue area – duration of water addition
DFF Sensor Raw Data with Zero Correction • 1% HPC batch • Increase in DFF shear during water addition and wet massing phase evident.
DFF Sensor Raw Data with Zero Correction • 3% HPC batch • Increase in DFF shear during water addition and wet massing phase evident. • 3% HPC provides signal differentiation from 1% HPC batch
DFF Sensor Raw Data with Zero Correction • 5% HPC batch • Increase in DFF shear during water addition and wet massing phase evident. • 5% HPC batch has signal different than 1% and 3% HPC
DFF Sensor Time Resolved Signal Peaks due to consolidated granule impacts Continuous signal due to wet mass flow (sine fit) • Peak amplitude is proportional to the mass of the granule • Sine fit amplitude is proportional to the density of wet mass
Fast Fourier Transformation • High resolution data collection allows processing options such as FF transformation
Amplitude of the Fundamental Harmonic • DFF sensor is ability to differentiate batches made with different HPC % w/w content as well as different stages of processing.
Highest Peak Magnitude • DFF sensor is able to differentiate batches made with different HPC % w/w content as well as different stages of processing.
Time Dependent Histogram of Peak Amplitude Distribution: 1% HPC
Time Dependent Histogram of Peak Amplitude Distribution: 3% HPC
Time Dependent Histogram of Peak Amplitude Distribution: 5% HPC
Sine Function Amplitude After Distribution Fitting • DFF sensor is able to differentiate batches made with different HPC % w/w content as well as different stages of processing.
Particle Size Distribution: Sieve Analysis • No significant difference in the particle size distribution of batches manufactured with different % w/w HPC levels. • Indicates the ability of DFF shear sensor to quantitate a binder-level related in-process attribute that is not necessarily PSD dependent.
Results • Particle Size: • Differences in the rate of granule growth with different concentrations of HPC were evident in the FBRM measurement. • Shear: • A high acquisition rate sensor that measures drag force on a thin cylindrical pillar provided high resolution unipolar signal, i.e., the pillar did not oscillate but deflect under an applied force and then quickly relaxed back into the equilibrium position. • Signal consisted of separate peaks, and their frequency generally synchronized in time with blades passing below the sensor. • The time-dependent periodic signal was clearly synchronized with the frequency of blades passing the sensor, and included a number of peaks of variable magnitude that may be interpreted as particle or granule impacts.
Conclusions • The peak amplitudes were a function of the concentration of HPC used in the batch. • Basic statistical analysis of peak magnitudes suggested potential the development of a procedure to quantitatively characterize such parameters of the wet mass as densification, tackiness, and particle growth. • The DFF sensor was able to capture anticipated differences in wet mass consistency with different concentrations of binder.