Download
1 / 27
270 likes | 434 Views
Peace Julie Nakayima July 10, 2008 Capstone Project. Overview of scientific literature Methods Results Discussion Implications for public health Limitations. Table 1. Literature Review Study Findings

E N D
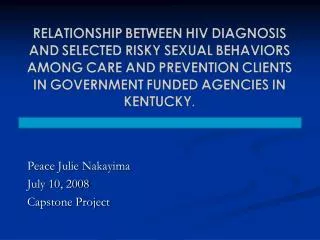
Peace Julie Nakayima July 10, 2008 Capstone Project
Overview of scientific literature • Methods • Results • Discussion • Implications for public health • Limitations
Table 1. Literature Review Study Findings CDC, 20061 HIV prevalence18.5 per 100,000: steady increase 2003-2006. CDC, 20062-3 1.1 m people with HIV & 24%-27% of them unaware of their infection. CDC,20053 Other studies of high risk Rotheram,20004 groups reported unawareness as high as 50%. MMWR, 20025 38%-44% of adults tested; 22m tested annually.
Table 1. Literature Review cont. StudyFindings Barroso et al., 20006 Positive outcomes of early diagnosis both individually & to the wider population. Kalichman et al., 19997 2/3 of HIV+ MSM reported no unprotected sex within past 3-6 months. Marks et al., 20058 Prevalence of unprotected sex 53% lower in HIV+ aware. CDC, 19939-11 Unaware participants did not reduce risky behaviors.
To determine whether HIV diagnosis influences engagement in risky sexual behavior among HIV care and prevention clients in Kentucky.
Original study= 1206 participants • A cross-sectional study • Participation Rate of 60.3% • Probability proportionate to size sampling technique
Data were collected from HIV/AIDS agencies or prevention events off site in Summer 2007. • Prevention clients completed 52 questions, and care clients completed 87 questions on the 2007 HIV needs assessment survey. • Study approved by UK- IRB on January 8, 2008.
1206 HIV- 545 HIV+ 436 Don’t know 192 3+ years 346 ≤ 2 years 90
Number of sex partners was compared for HIV+ and HIV- participants. • Forms of unsafe sex (oral, vaginal-penile, and anal) were also be compared for both groups.
Data analyzed with SPSS 15.0 • Data statistically significant at p ≤ 0.05 • Chi-Square tests at the bivariate level
Logistic Regression at the multivariable level. • Confounding variables: age; sex; race; residence; sexual orientation; alcohol use; tobacco use; recreational marijuana; and illicit drugs were adjusted for.
Table 2. Demographic Characteristics of the HIV Care and Prevention Clients (n=891) Correlate Frequency (n) Percent (%) Sex* Male 543 62.6 Female 324 37.4 Age* 0-29 346 39.0 ≥ 30 541 61.0 Race* White 465 52.8 Minority 415 47.2 Sexual Orientation Heterosexual/ Straight 555 63.9 Non Heterosexual 314 36.1 HIV Status Negative 545 61.2 Positive 346 38.8 Residence* City 596 68.3 Country 276 31.6 Education Level* High School Diploma or Less 417 48.5 Some College or More 443 51.5 Illicit Drugs ▪* Non Users 649 72.8 Used 1 or more 210 23.6 ▪Includes Cocaine, Methamphetamines, Heroin, and Ecstasy. *Some values missing due to missing data
Outcome PR* 95% CI▪ Multiple Sex partners 0.63 0.53-0.73 Unsafe Oral Sex 0.54 0.46-0.62 Unsafe Vaginal Sex 0.34 0.27-0.43 Unsafe Anal Sex 0.83 0.66-1.04 *Prevalence Ratio ▪Confidence Interval
Table 4. Multivariable differences between HIV status and Risky Sexual Behavior† Multiple Sex Partners 0.451 0.31- 0.66 Unsafe Oral Sex 0.272 0.18- 0.40 Unsafe Vaginal-Penile 0.203 0.14- 0.30 Unsafe Anal Sex 0.502 0.31- 0.80 Outcome AOR* 95% CI‡ †In the past two years. *Adjusted Odds Ratio 1Adjusted Odds Ratio for age, sex, race, place of residence and illicit drugs (including Cocaine, Methamphetamines, Heroin, and Ecstasy). 2Adjusted Odds Ratio for age, sex, race, place of residence, sexual orientation, tobacco use, marijuana for recreational use, and illicit drugs (including Cocaine, Methamphetamines, Heroin, and Ecstasy). 3Adjusted Odds Ratio for age, sex, race, place of residence, marijuana for recreational use, and tobacco use. ‡95% Confidence Interval.
HIV+ status had protective effects, so HIV transmission can be reduced by increasing serostatus awareness among HIV+ • Substantial proportion of HIV+ still engaging in risky sexual behavior: multiple partners 36.3%; oral 37.3%; anal 25.6% • HIV- clients were more engaged in risky behaviors.
Findings consistent with previous research7-8 and with the CDC SAFE initiative: • Increasing the number of HIV+ people who know their status • Increasing HIV+ who adopt and sustain HIV-STD risk reduction behavior. • Findings generalizable to HIV/AIDS clients seeking services in similar settings in the state and other states with similar agencies.
Regular HIV testing needs to be highlighted in all HIV/AIDS prevention strategies. • HIV/AIDS prevention agencies constitute an important venue for HIV prevention programs.
Cross sectional study • Retrospective self-reported data: Recall bias; social desirability bias • Convenience sample • Data collected for only 1.5 months
1.Centers for Disease Control and Prevention. HIV/AIDS Surveillance Report, 2006. Vol. 18. Atlanta: U.S. Department of Health and Human Services, Centers for Disease Control and Prevention; 2008: [pp.6]. http://www.cdc.gov/hiv/topics/surveillance/resources/reports/ 2. Centers for Disease Control and Prevention. Epidemiology of HIV/AIDS–United States, 1981-2005. MMWR Morb Mortal Wkly Rep. 2006;55(21):589-592. 3. Glynn M, Rhodes P. Estimated HIV prevalence in the United States at the end of 2003 [Abstract T1-B1101]. Programs and abstracts of the 2005 National HIV Prevention Conference; June 12–15, 2005; Atlanta, GA. Available at http://www.aegis.com/conferences/nhivpc/2005/t1-b1101.html. 3. Centers for Disease Control and Prevention. HIV prevalence, unrecognized infection, and HIV testing among men who have sex with men- five US cities, June 2004- April, 2005. MMWR Morb Mortal Wkly Rep 2005; 54:597–601. 4. Rotheram-Borus MJ, Futterman D. Promoting early detection of human immunodeficiency virus infection among adolescents. Arch Pediatr Adolesc Med 2000; 154:435–9. 5. CDC. Number of persons tested for HIV- United States, 2002.MMWR 2004;53:1110-3.
6. Barroso PF, Schechter M, Gupta P. Effect of antiretroviral therapy on HIV shedding in semen. Ann intern Med 2000; 133:280-4. 7. Kalichman SC. Preventing AIDS: A source book for behavioral interventions. Mahway,NJ: Lawrence Erlbaum Associates. 8. Marks G, Crepaz N, Senterfitt JW, & Janssen RS. Meta-analysis of high-risk sexual behavior in persons aware and unaware they are infected with HIV in the United States: Implications for HIV prevention programs. J Acquir Immune Defic Syndr. 2005; 39:446-453. 9. CDC. Technical guidance on HIV counseling. MMWR 1993; 42 (No. RR-2):11-7. 10. Association of State and Territorial Health Officials. Guide to public health practice: HTLV-III screening in the community. McLean, VA: Association of State and Territorial Health Officials Foundation; 1985. 11. CDC. Public Health Service guidelines for counseling and antibody testing to prevent HIV infection and AIDS. MMWR 1987; 36:509-15.
Committee • Dr. Crosby, Ph.D • Dr. Jones, Ph.D • Dr. Browning, Ph.D • Kentucky Department of Public Health • Mr. David Clark • UK College of Public Health
Stratified analyses of selected demographic characteristics and risky sexual behaviors. Correlate Outcome Multiple partners unsafe oral unsafe vaginalunsafe anal AOR*(95%CI) AOR**(95%CI) AOR***(95%CI) AOR**(95%CI) Sex (females vs males) 0.59(0.42-0.81) 1.39(0.97-2.02) 1.79(0.25-2.58) 1.01(0.67-1.52) Age (≥30 vs ≤29) 0.60(0.42-0.84)0.66(0.45-0.96) 0.57(0.39-0.83) 0.73(0.49-1.1) Race(minority vs White) 1.1(0.78-1.5) 0.81(0.57-1.15) 0.89(0.63-1.28) 1.05(0.72-1.5) * Adjusted Odds Ratio for age, sex, race, place of residence and illicit drugs (including Cocaine, Methamphetamines, Heroin, and Ecstasy). **Adjusted Odds Ratio for age, sex, race, place of residence, sexual orientation, tobacco use, marijuana for recreational use, and illicit drugs (including Cocaine, Methamphetamines, Heroin, and Ecstasy). ***Adjusted Odds Ratio for age, sex, race, place of residence, marijuana for recreational use, and tobacco use. CI- Confidence Interval
Comparison of Risky Sexual Behaviors and Other Variables Reported by HIV Serostatus. Total=545 Total=346 Correlate HIV Negative (n, %) HIV Positive (n, %) p Number of Sex Partners Non-Multiple 218(41.9) 209(63.7) <.0001 Multiple 302(58.1) 119(36.3) Unsafe oral sex Yes 350(69.9) 118(37.3) <.0001 No 151(30.1) 198(62.7) Unsafe vaginal-penile sex Yes 282(56.7) 61(19.4) <.0001 No 215(43.3) 253(80.6) Unsafe anal sex Yes 151(30.9) 80(25.6) 0.105 No 338(69.1) 233(74.4) Age 0-29 310(89.6) 36(10.4) <.0001 30 and Older 231(42.7) 310(57.3) Sex Male 293(54.0) 250(46.0) <.0001 Female 241(74.4) 83(25.6) Race Minority 301(72.5) 114(27.5) <.0001 White 236(50.8) 229(49.2) Residence City 377(63.3) 219(36.7) 0.028 Country 153(55.4) 123(44.6) Education Level High School Diploma or Less 262(62.8) 155(37.2) 0.268 Some College or More 262(59.1) 181(40.9) Sexual Orientation Heterosexual or Straight 416(75.0) 139(25.0) <.0001 Non- Heterosexual 121(38.5) 193(61.5) Tobacco Use Yes 315(58.1) 227(41.9) 0.012 No 206(66.9) 102(33.1) Alcohol Use Yes 354(62.0) 217(38.0) 0.589 No 167(60.1) 111(39.9) Marijuana (Recreational Use) Yes 238(67.6) 114(32.4) 0.001 No 283(56.6) 217(43.4) Illicit Drugs Non Users 385(59.3) 264(40.7) 0.043 Used 1 or more 141(67.1) 69(32.9)