Download
1 / 12
120 likes | 140 Views
This article delves into various indices measuring ED crowding, discussing the significance of real-time monitoring, adverse outcomes, and the need for national measurement standards. It explores the limitations of certain metrics and suggests alternatives for accurate assessment.

E N D
Indices of ED crowding Stephen Pitts MD, MPH Emory University Department of Emergency Medicine
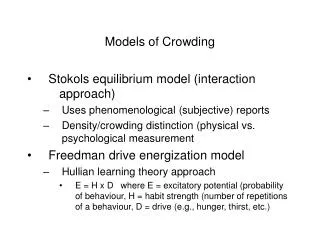
Why measure crowding? • Prevent adverse outcomes in real time • Adverse outcomes: delays, morbidity, mortality • Proxy outcomes: • Waiting time • Ambulance diversion • LWBS rate (Left without being seen) • Alarm bell function: call in backup • Crowding indices that use realtime ED flow tracking • EDWIN: ED work index • READI • NEDOCS: proprietary system • ED work score
Why measure crowding nationally? • Measure system performance • Evaluate temporal trend • EDs are “canary in coalmine” for healthcare system • Compare EDs (benchmarking) • Practice variation = inequity in cost, quality • Marketing = product differentiation
Many other potential indices Ann Emerg Med. 2003;42:824-834
Calculating occupancy in NHAMCS-EDpublic use data • Not available: • Staffing levels • ED bed availability • Hospital bed availability • Date of visit (only month, day of week) • Available since 2001: • Time of arrival • Length of visit in minutes
National ED arrivals vs. occupancy(2001-2007 NHAMCS-ED surveys combined) Error bars are 95% confidence intervals
National ED arrivals vs. occupancy(2001-2007 NHAMCS-ED surveys combined) Mean occupancy Efficiency ratio = 12/38 = 0.32 Mean arrivals Error bars are 95% confidence intervals
Problems with occupancy • No national denominator (# of treatment spaces) • # of spaces probably decreased nationally 2001-2007 • Underestimates crowding trend • Time of discharge = problematic item • Actual ED departure harder to get than time of admission • Underestimates boarding, crowding • Occupancy is an ED-level characteristic • NHAMCS-ED surveys 350+ EDs • ED identity and characteristics are masked • Avg 100 surveys per ED annually • Too few for ED-specific occupancy/efficiency estimate • Solution: proxy for crowding = length of visit • Patient-level analysis