
Transparency 2
E N D
Presentation Transcript
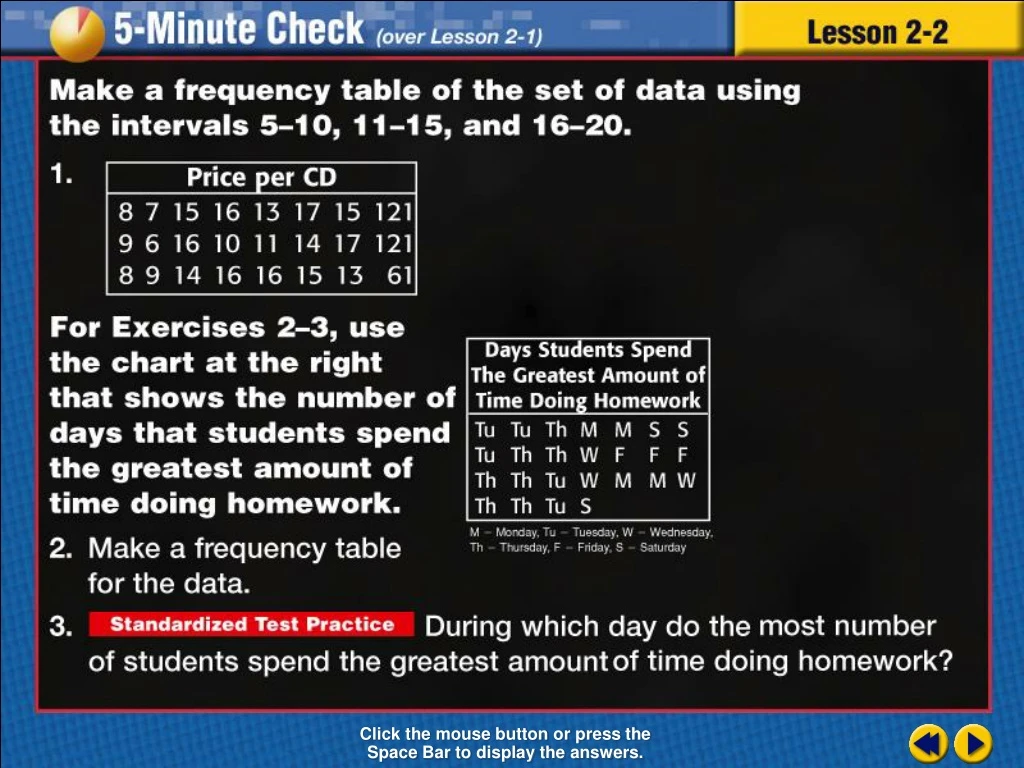
Transparency 2 Click the mouse button or press the Space Bar to display the answers.
Example 2-2a Objective Make line graphs and make predictions from graphs
Example 2-2a Vocabulary Line graph A type of statistical graph using lines to show how values change over a period of time
Example 2-2a Vocabulary Scatter plot Two sets of related data are plotted as ordered pairs on the same graph
Lesson 2 Contents Example 1Make and Use a Line Graph to Predict Example 2 Use a Scatter Plot to Predict
Example 2-1a TYPINGEnrique is writing a 600-word paper for class. The table shows the time it has taken Enrique to type the paper so far. Make a line graph and predict the total time it will take him to type his paper. Decide on a scale and interval The scale must include 0 and 600 An appropriate interval would be 100 Remember to make your intervals easy
Example 2-1a Begin each line graph with 0 in the lower left corner Add 100 up the vertical scale labeling the lines Label the vertical axis
Example 2-1a Label the horizontal axis Since we are predicting you must include categories Reminder: Line graph uses the lines not the spaces
Example 2-1a Time to Type a Paper Write a title with a relationship between the vertical and horizontal axis
Example 2-1a Time to Type a Paper Plot data vertically
Example 2-1a Time to Type a Paper Draw a line of best fit to predict how long it will take to type 600 words
Example 2-1a Time to Type a Paper Find where the line connects the 600 words and place a dot
Example 2-1a Time to Type a Paper Read the horizontal axis below the dot to estimate the time Answer: About 14 minutes
Example 2-1b TRAVELDuring a recent road trip, Helen kept track of the number of miles traveled after each hour of travel time was completed. The table below shows her information. Make a line graph and predict how far Helen will travel in 12 hours of travel time. 1/2
Example 2-1b Answer: In 12 hours, Helen will travel about 700 miles. 1/2
Example 2-2a POLLUTIONThe scatter plot shows the number of days that San Bernardino, California, failed to meet air quality standards from 1990 to 1998. Use it to predict the number of days of bad air quality in 2004. Locate 2004 on the horizontal axis Move up the vertical axis to where the line crosses Move across the horizontal axis to the number of days 2/2
Example 2-2a POLLUTIONThe scatter plot shows the number of days that San Bernardino, California, failed to meet air quality standards from 1990 to 1998. Use it to predict the number of days of bad air quality in 2004. Estimate the number of days they failed to meet standards in 2004 It is more than 40 but not half way between 40 and 60 Answer: About 45 days 2/2
Example 2-2b * GAS MILEAGEThe scatter plot shows the gas mileage based on the weight of a car. Use it to predict the gas mileage for a car weighing 5500 pounds. Answer: about 20 mpg 2/2
End of Lesson 2 Assignment