Download

1 / 44
450 likes | 473 Views
Learn to map, analyze, and improve value chains for business growth. Understand economic, environmental, and social impact. Develop effective business models and upgrade services. Use data monitoring for better value chain strategies.

E N D
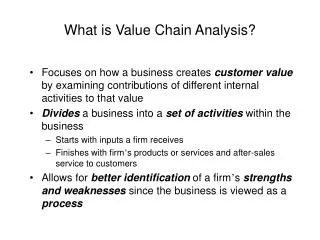
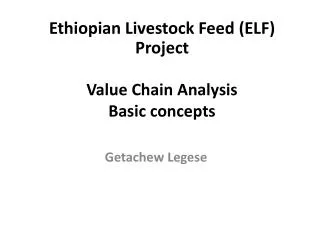
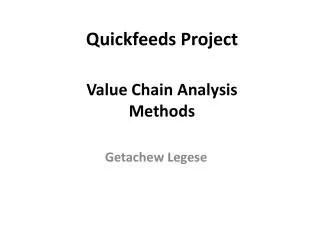
ValueLinks Module 2 Value chain analysis
ValueLinks 2.0 Setting boundaries Chain analysis and strategy VC upgrading solutions Monitoring 1 2 5 11 Value chain analysis Managing data & monitoring Scope of value chain development Business models 6 Business linkages 3 Value chain strategies 7 Services 4 Programs and projects 8 VC Financing 9 Quality and standards Solutions for improving thevaluechain 10 Policy instruments
The Toolbox for Chain Analysis Contents 1 Value chain mapping 2 Economic analysis of value chains 3 Environmental analysis of value chains 4 Social and poverty analysis of value chains
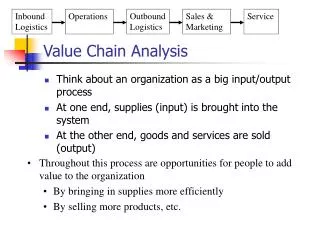
Contents of value chain maps Basic value chain maps visualise… • The sequence of production and marketing functions performed • The value chain „operators“ taking these functions (micro level) • Vertical business links between the operators • The chain „support service providers“ (meso level) 1
Basic concepts Value chain functions Specific Inputs Trans- formation Commerce Trade Con- sumption Production Provide - equipment - inputs Grow Harvest Dry etc. Classify Process Pack Transport Distribute Sell Consume 1 Categories of actors in value chains and their relations Specific Input providers Primary producers Packers, Industry Traders (sales pt.) Consumers (the market)
Value chain map Consumers (the market) Consump-tion Retail (final sales point) Retailer Wholesalers Wholesale 1 Trans-formation Packers / Industry Support Service Provider 2 Primary Producers Production Support Service Provider 1 Specific Inputs Specific input providers
How to proceed in mapping Steps • Specify the final product and end market(s) • Establish the stages of the chain (specifying the functions performed) • Establish the main sequence of operators • Differentiate the chain into channels if appropriate • Map support service providers • Prepare thematic detail maps if required 1
Fresh Table Apple (traditional varieties), Georgia National Consumers Consumption 2006: 35000 t average: 70000 t Supermarkets in big urban centres Small food stores Open market traders Street vendors Retail Intermediary trade (sorting for quality) Fruit traders 1 Antonovka 3-5 Lari / kg Kechura 1-2 Lari / kg Farmers Sorting table/industry apples Farmer associations Extension services Ministry of Agriculture Primary production Provision of seedlings Local tree nurseries
Leather, Ethiopia Leather Product Industry Traders of finished leather Leather trade Processing of skins Tanneries 1 Raw skin trade Skin Traders 94% 0,5% 5,5% Collection Preservation Skin collectors Private slaughterers Abbatoirs Slaughtering Animal Husbandry Pastoralists Small farmers Commercial breeders
Segmenting channels & business models Criteria • Type ofproduct • Low, medium or high quality product • Price • Intermediate or final product • End market • Rural, urban or export market • Type of customers (price-sensitive or quality conscious) • Technology • Stage (from low to high input / hand-made or mechanized) • Type and (minimum) scale of processing enterprises (from small artisanal to large-industrial) • Linkages • Type of business linkages between suppliers and buyers 1
Jute products, Bangladesh 90% of Jute 8% of Jute CJP for export Foreign buyers of CJP Foreign buyers of DJP DJP for export Export Exporters/ Traders Exporters/ Traders 2 % of Jute DJP for local Retailers Retail DJP Production Producers (organized in a cluster) Semi-industrial factories 1 Conversion Yarn - fabric Furnishers/ Converters Milling Jute Mills Jute product value chain Fibre Trade Local Traders/ Purchase Centres CJP = conventional jute products DJP = diversified jute products Fibre Collection Intermediaries Jute Growing Jute Growers
Maize, African country Domestic markets food/feed Intra-regional export Domestic flour markets Animal feed markets Traders on food markets Public programs Food shops Retail Wholesale traders Institutional buyers (WFP) Exporters Flour traders Feed traders Wholesale 1 Industrial millers Milling Intermediate trade Local assemblers Maize production Smallholders (selling surplus) Commercial farmers Contract farmers Seed supply Seed dealers
Vertically integrated value chain Marketing Exporter Exclusive buyer/ Exporter finishing Small integrators Large Integrator weaving 1 dyeing spinning Small integrators carding
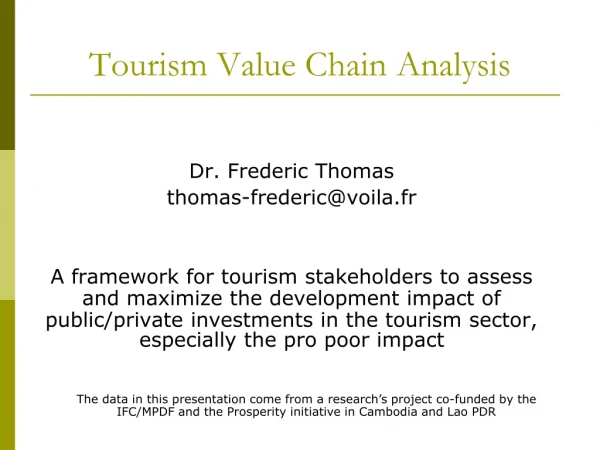
Chain mapping in the tourism sector Marketing and Sales Air / Sea Transport Ground Transport Accom- modation Food and Beverages Activities Travel Agencies Ferries Local public transport Pensions Cafés Sport services Resorts Event managers Private taxis and buses Online Portals Airlines Restaurants 1 Hotels Tour guides Tour operators Department of Tourism (DOT) Local Government Units (LGU)
VC map bamboo/rattan handicrafts, Northern Vietnam Handicraft Production Intermediary Trade Raw Material Supply International Market National Market ProvincialHandicraft Producer/ Exporter National Exporters National Traders Trading and Finishing Provincial Handicraft Producers Village Trade Clusters 1 Producers of semi-finished handicraft articles (Farmers, Groups of Farmers) Traders and Focal Points of Handicraft Producers/Exporters Small Traders/Raw Material Processors Processing Dark green: within project districts Light green: within provinces Small Traders Bamboo and Rattan Collectors/Harvesters
Quantification Importers n = 5 Large scale processing companies Export Market Input suppliers n = 3 n = 2 n = 40 Producers Turnover: 200 Mio € 1 n = 10 Retailers A Industrial SME’s Market 1 Small producers n = 8000 Turnover: 20 Mio € n = 120 n = 800 • Or • Number of Employees • % of women employed • Product quantity Retailers B Market 2 Turnover: 30 Mio €
Meso Macro Large-scale VC map: Export coffee, Ethiopia Micro 1
What makes a good map Criteria • Make sure the map has a clear message • Avoid overload of information – not more than 2 or 3 channels at a time. • Separate micro and meso analyses • The map has to be understandable to people who have not participated in making it! 1
The Toolbox for Chain Analysis Contents 1 Value chain mapping 2 Economic analysis of value chains 3 Environmental analysis of value chains 4 Social and poverty analysis of value chains
Economic analysis Elements of the economic analysis • Size and market share of VCs in global and domestic markets • Production and consumption figures • Export and import figures (using WTO records) • Share of the VC in the total export value • Value-added along the value chain • Contribution of chain segments to total value • Benchmarking important VC parameters • Benchmarking of unit cost of production • Benchmarking of labour and other factor productivities 2
Concept of value addition Amla Candy Value addition by the VC Other inputs/operational services Productprice per kg ofAmla Intermediate product 12 Rs 80 Rs Retail 8 Rs 60 Rs Wholesale 2 20 Rs 44 Rs Processing 8 Rs 16 Rs 5 Rs Trading 5 Rs Primary production Farmer Agent Process. Wholes. Retailer
Calculation of value-added Components of the value generated by the VC • VALUE-ADDED • captured in one stage of VC • Wages • Interests and rents • Depreciation • Direct taxes • Profit Used to pay claims of the owners of factors of production (capital, labour, land) + taxes VALUE GENERATED by the value chain or by stages of the VC = Price*volume of product sold • OTHER INPUTS & SERVICES • Inputs, equipment • Energy, water • Operational services 2 Transferred to external suppliers • INTERMEDIATE PRODUCTS • Raw material, semi- finished or traded product (depending on VC stage) Transferred to operators at the previous stage
Value-added captured by the VC …along the value chain Primary Producers Product Makers Consumers Traders Value-added Value-added captured by the VC Value-added Total Value consumed Intermediate Product Intermediate Product Value-added 2 Value-added going to Input providers outside the VC Other Inputs Other Inputs Service / Input Providers Service / Input Providers Value-added Value-added
Assessing competitive advantage Comparing performance in footwear: India – Italy – China 2 Source: Learning From Global Buyers; H. Schmitz, P. Knorringa
The Toolbox for Chain Analysis Contents 1 Value chain mapping 2 Economic analysis of value chains 3 Environmental analysis of value chains 4 Social and poverty analysis of value chains
Environmental analysis of value chains Procedure in three steps Qualitative assessment Tools • Step 1 • Conceptual model of the interaction between the VC and the environment. • - Environmental impact matrices • Step 2 • Identification of environmental impacts of the VC and on the VC • - Lifecycle inventory 3 • Step 3 • Assessment and valuation of the environmental impacts • - TEEB • - Measures of resource efficiency • - Footprinting • - Environmental indicators • - Identification of hot spots
Productionof paddy Rice VC – technical systems From VC functions to technical systems Stages of the VC Technical systems 1.1 Upland rice 1 Primary production Seed delivery 1.2 Lowland / swamp 1.3 irrigated rice 2 Intermediate trade 2.1 bulking, storage Intermediate trade 3 Processing Processing(Parboiling) 3.1 parboiling 3 3.2 milling (white rice) Processing(Milling) 4 Trade wholesale/retail 4.1 transport Wholesale tradeexport 4.2 storage, packaging, Trade retail 5 Consumption 5.1 Cooking Preparation,Cooking
Environmental analysis of value chains The link between value chains and the environment 3
Rice VC – resources and ecosystems Relevant resource categories and ecosystems Water Issues: Pollution, excessive consumption, price hikes (pumping cost), water shortages due to drought/decreasing water table, late rains/extended dry season Energy Issues: Low energy efficiency, fuel price inflation, blackouts, access to fuel wood, charcoal Soil Issues: Soil fertility, erosion Ecosystems Issues: Swampecosystemservices, biodiversity Climate Issues: Excessive heat, violent rains, flooding, strong winds 3
Environmental impact matrix 3 Impact ofthe VC (type 1) Impact onthe VC (type 2)
The Toolbox for Chain Analysis Contents 1 Value chain mapping 2 Economic analysis of value chains 3 Environmental analysis of value chains 4 Social and poverty analysis of value chains
Gender mapping Gender mapping of business operations Typical division of tasks in African agriculture Wholesale retail trade Trans- formation Input delivery Bulking Production Growing - plantation - maintenance - harvest - fielddrying Processes - drying - selection - packaging - transport - marketing Provision of - equipment - inputs Intermediarytrade ♂ ♂ ♂ ♂ ♂ ♂ ♂ ♂ ♀ ♀ ♀ ♀ 4
Paddy production Gender mapping Gender mapping of the rice VC, West Africa InputSupply Paddy bulking Processing;parboiling Wholesale Trade Retail ♂ ♂ ♂ Producer groups Semi-industrial rice mills ♂ Local traders ♀ ♂ Shops/ Instit-tutional buyers Urban markets Private agrodealers ♂ Whole sale traders ♂ ♀ Parboiling Centres Women groups ♂ ♀ Traditional Producer Groups Ministry of Agriculture Local markets ♀ ♀ ♂ ♀ Individual small-scale parboilers Village rice farmers 4
Mapping poor producers Poverty mapping of low-value staple foods Own consump-tion 25% Smallholder Growers 5% Local inter- mediaries village traders 20% Rural markets for cheap staple food Wholesale Traders and Importers Com-mercial retailers Medium to large farms 50% 4 market shares = poor producers = poverty markets
Describing poverty groups Poverty mapping of low-value staple foods Consumers (market) Wholesale Traders Retail Traders Processors Growers • Poverty rate: % / number below the national poverty line • Average income: Average income: … $, • Food insecurity: May – July • Skills: x% illiterate, no access to education • Social problems: e.g. child labor,at farm level • Poverty rate: % / number of workers below the poverty line Average income:Average income … $ • Skills: x% illiterate, no vocational training • Social problems: e.g. work safety, no child care services for women 4 = poor producers = poor workers
Livelihood analysis The „multi-chain perspective“ of poor people Market Industry ….working as wage labourer Market Smallholder producer ….producing commercially Industry Trade 4 Market ….pursuing other businesses
Poverty and competitiveness Constraints of poor producers Lack of productive resources • Limited access to productive resources • Lack of capital Market failure affecting the poor - exclusion • Absence of services and products for poor producers • Inefficient markets – high cost of transaction, little trust Scale issues 4 • Small scale, informality, unfavorable contracts • Barriers to scaling up production (shifting to larger scale business models) • Weak position of SMEs/excessive buyer power
Poverty and vulnerability …linked to their business model Financial stability • High price volatility • Exclusion of small suppliers in demand crises • Vulnerability of the poor during economic crises Technological and ecological sustainability • Pollution and depletion of natural resources (especially in a short-lived export boom) Social sustainability 4 • Conflicts over the use of natural resources and/or conflicts between commercial and subsistence production • conditions of employment
Summary: Main lessons to remember • Value chain analysis creates a picture of the socio-economic reality. It always shows the present situation first – as a basis for projections guiding development action. • The VC map shows the structure of the VC and is the foundation for any other type of VC analysis. Of particular interest for ValueLinks are the economic, environmental and social aspects of VCs and gender dimension. • Economic VC analysis quantifies the total value created by the value chain and its composition. It also assesses the functioning and the competitiveness of the chain as a whole. • Environmental analysis shows how the technical processes in the VC interact with ecosystems and the natural resources utilized for producing. The environmental impact matrix allows identifying both environmental impacts on the VC (type 1) and impacts of the VC on the environment (type 2). Analysts have to judge the severity of the impacts to identify hot spots. • Social analysis identifies three types of poverty groups in value chains – poor micro entrepreneurs, poor wage workers/unemployed, and poor consumers. Each group is located in the VC map. The analysis characterizes these groups and their livelihood conditions. • Gender analysis starts by introducing gender aspects into the VC map. This refers to the role of women and the constraints they face in economic life.