Download
1 / 18
220 likes | 543 Views
Introduction to NMR Spectroscopy. Part III (DEPT and 2D-Methods). DEPT-Introduction. Recall that most 13 C-NMR are acquired as proton decoupled spectra because of the 13 C nucleus is significantly less abundant than the 1 H nucleus

E N D
Introduction to NMR Spectroscopy Part III (DEPT and 2D-Methods)
DEPT-Introduction • Recall that most 13C-NMR are acquired as proton decoupled spectra because of the 13C nucleus is significantly less abundant than the 1H nucleus • DistortionlessEnhancement by Polarization Transfer, or also called DEPT, is a technique that is used to compensate for some shortcomings of 13C-NMR spectroscopy • The technique utilizes the fact that different CH-functions behave differently in an experiment, where the polarization is transferred from the proton to the carbon atom DEPT-45
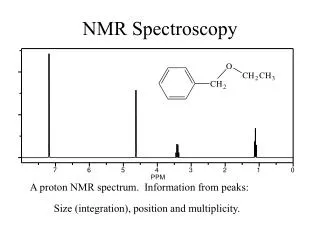
DEPT-Example I 1/6 • The original spectrum of isoamyl acetate displays only six signals due to the symmetry in the side chain • The carbonyl carbon atom at d= 172 ppm does not show up in either DEPT spectrum because it is quaternary • The methylene functions at d= 38 ppm and d= 61 ppm point down in the DEPT 135 spectrum • The methine function at d= 25 ppm shows up in all three DEPT spectra • The DEPT spectrum can not determine which of the signals at d= 21 ppm and d= 24 ppm belongs to C1 and C6 Full Spectrum 3 4 5 2 DEPT 135 DEPT 90 DEPT 45
DEPT-Example II • The full spectrum of camphor displays ten signals • The signal at d= 215 ppm is due to the carbonyl group • The signals at d= 47 ppm and d= 57 ppm are due to the other two quaternary carbon atoms • Thus, these three carbon atoms do not appear in any of the DEPT spectra 2 3 1
DEPT-Example II • The range of the DEPT spectra show here is from d= 0-50 ppm (the three quaternary peaks are removed) • The signal at d= 43.6 ppm (furthest to the left) is due to the methine function (C4) • The signals at d= 43.4 ppm, d= 30 ppm and d= 27 ppm are due to methylene groups (C5, C6, C7) • The signals at d= 19.8 ppm, d=19.2 ppm and d= 9 ppm are due to the methyl groups (C8, C9, C10) • For the methylene and the methyl groups, it is very difficult to determine which signal is due to which carbon atom without additional information 4 6 7 8 9 10 5
DEPT-Example III • The reaction of 1,2-diphenylpropanediol with acids leads to the formation of an aldehyde (I) or ketone (II) (or a mixtureof them) depending on the conditions during the reaction (i.e., temperature, amount and type of catalyst, etc.). • How could the 13C-NMR spectrum and the DEPT spectra be used to determine the nature of the product?
DEPT-Example III • The aldehyde displays seven signals due to the symmetry of the two phenyl groups. • Aldehyde carbon: 201 ppm • Four carbon atoms: 126-145 ppm • Quaternary carbon atom: 62 ppm • Methyl group: 21 ppm Full Spectrum 2 signals DEPT 135 DEPT 90 DEPT 45
DEPT-Example III • The ketone displays eleven signals due to the lack of symmetry • Ketone carbon: 200 ppm • Eight carbon atoms: 128-141 ppm • Methine carbon atom: 48 ppm • Methyl group: 20 ppm Full Spectrum DEPT 135 DEPT 90 DEPT 45
2D Techniques - Introduction • There is a broad variety of two-dimensional NMR techniques used in chemistry and biochemistry to deduce structures for relative complicated molecules i.e., proteins, macromolecules, etc. • Some of these experiments allow the experimenter to get additional information about his molecule since some of these techniques to look at long-range effects or connectivity between different types of atoms.
2D Techniques - Introduction • Here we will only discuss HMQC spectroscopy, which permits conclusions about which carbon atom is connected to which hydrogen atom(s). The other, more advanced techniques require a more in-depth knowledge of NMR spectroscopy.
2D Techniques – Example I • In the HMQC spectrum, the horizontal axis displays the 1H-NMR (d= 0-4.5 ppm) spectrum while the vertical axis displays the 13C-NMR spectrum (d= 15-65 pm) • The 1H-NMR spectrum displays the following signals: 0.7 ppm (d, 6 H, H6), 1.25 ppm (q, 2 H, H4), 1.45 ppm (m, 1 H, H5), 1.75 ppm (s, 3 H, H1) and 3.75 ppm (t, 2 H, H3) • Thus, the signal at d= 21 ppm belongs clearly to the methyl group that is attached to the carbonyl group while the signal at d= 22 ppm is due to the two methyl groups in the alkyl chain H1 1H-NMR H6 H4 H3 H5 13C-NMR
2D Techniques – Example II • The signal at d= 9.25 ppm in the carbon spectrum relates to the signal at d= 0.75 ppm in the 1H-NMR spectrum, while the two signals at d= ~19 ppm relate to the signals at d= 0.7 ppm and d= 0.82 ppm in the 1H-NMR spectrum. • The signals at d= 27, 30 and 43.3 ppm are each connected to two different hydrogen atoms (1.24 and 1.85, 1.28 and 1.61, 1.77 and 2.28 ppm) which implies that these are diastereotopic hydrogen atoms. The resulting coupling with other hydrogen atoms on neighboring carbon atoms leads to complicated splitting patterns (i.e., ddddd). • Finally, the signal at d= 43.1 ppm is connected to one proton signal (2.01 ppm).
2D Techniques – Example III • Trans-Ethyl crotonate (HMQC) • How many signals do we expect? • 1H-NMR? • 13C{1H}-NMR? • The hydrogen atom and the carbon atom in the b-position to the carbonyl group are more shifted than the corresponding atoms in the a-position because of the resonance effect dqd q d t dq q d t d 5 6
2D Techniques – Example III • Trans-Ethyl crotonate (HMBC) • In the HMBC spectrum, the two- and three- bond couplings between protons and carbons can be seen as cross-peaks. • J correlations sometimes break through filter; show through filtershow up as multiplet cross-peaks.
2D Techniques – Example III • Trans-Ethyl crotonate (HH COSY) • The HH COSY shows the coupling network within the molecule • The triplet and quartet of the ethyl group share a cross peak • The alkene protons can be seen to couple to both each another and the terminal methyl group.
2D Techniques – Example IV • Strychine (HMQC) • In the HMQC spectrum, the one-bond direct CH couplings can be viewed as cross-peaks between the proton and carbon projections.
2D Techniques – Example IV • Strychine (HMBC) • In the HMBC spectrum, the two- and three- bond couplings between protons and carbons can be seen as cross-peaks. • The spectrum shows many more peaks than the HMQC
2D Techniques – Example IV • Strychine (HH COSY) • The HH COSY spectrum of strychnine shows the proton coupling network within the molecule.