Advancements in Solar X-ray Imaging: The Role of SXI in Solar Physics and Space Weather Forecasting
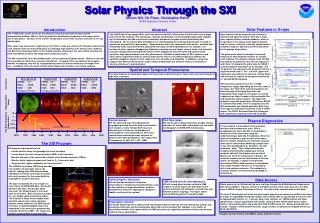
The GOES Solar X-ray Imager (SXI), launched in mid-2001, revolutionizes solar observation by providing continuous, real-time full-disk X-ray images of the sun with a one-minute cadence. This instrument enhances our understanding of solar phenomena such as flares, coronal mass ejections, and other geoeffective disturbances. By utilizing grazing incidence optics, SXI helps characterize solar features based on intensity and spectral content, allowing for improved forecasting of space weather events. The rapid cadence of SXI images will facilitate unprecedented studies of coronal structures.

Advancements in Solar X-ray Imaging: The Role of SXI in Solar Physics and Space Weather Forecasting
E N D
Presentation Transcript
1970 1975 1980 1985 1990 1995 2000 2005 2010 2015 2020 Solar Physics Through the SXI Steven Hill, Vic Pizzo, Christopher Balch NOAA Space Environment Center Solar Features in X-rays Introduction Abstract The 1-2 MK solar corona serves as the physical connection between the Sun and the interplanetary medium. Most if not all geoeffective disturbances originate in this region of the Sun’s atmosphere. Because of its extreme temperature, most of the corona’s emission is at x-ray wavelengths. After solar x-ray astronomy’s beginning in the 1950’s, it was not until the 1973 Skylab mission that x-ray images of the sun were obtained at a reasonably high cadence over several solar rotations. The Soft X-ray Telescope (SXT) on the Yohkoh satellite, launched in the early 1990s, continues to yield information on flares and large-scale coronal structures. The SXI instruments, like their predecessors, will use grazing incidence optics. However, they will fly as operational rather than research instruments. To support their operational role in space weather forecasting, they will fly in geostationary orbits for nearly continuous coverage of the sun. In addition, they will return full-disk solar images with at least a one minute cadence. The GOES Solar X-ray Imager (SXI), to be launched in mid-2001, will provide full-disk solar x-ray images with one-minute cadence. The continuous, real time examination of coronal morphology made available by the instrument will add a previously unavailable dimension to space weather forecasting and nowcasting. Use of archival data will improve our understanding of the physical processes involved in generation of geoeffective phenomena. Rapid cadence soft x-ray images will help resolve, spatially and temporally, many coronal elements associated with space weather disturbances, for example: the location of active regions, disappearing filaments, emerging coronal loops, coronal holes, and sigmoids. Unusual configurations among these features often suggest the onset of flares and coronal mass ejections, high speed streams, and other phenomena. Available combinations of SXI exposures and filters allow a significant range of coronal features that exist in very different physical states to be optimally imaged in relation to their respective size, intensity, and variability. In addition, using ratio images from different filters will be used to obtain temperature and emission measure estimates of discrete volumes of coronal plasma. Solar features can be characterized in terms of intensity and spectral content. Intensity is most often represented by emission measure, which is the product of the square of the plasma density and the volume. Intensity is directly proportional to emission measure. Spectral content is described by the plasma temperature. The green ovals show the ranges of expected temperature and emission measure for various solar features. The dynamic ranges of the two SXI instruments are plotted in blue for two exposures and filters. To interpret the plots, take the SXI-M 1 second exposure (top panel) as an example. The '10 photons' line represents the detection limit for a signal-to-noise ratio>3. The '~full well' upper limit represents saturation of the detector. Clearly flares and most active regions are beyond saturation for a 1 second SXI-M exposure. SXI maximum sensitivity is in the 1-10 MK temperature range, depending on the filter used. In the figure, the short (0.01 second) exposures are taken through a thick beryllium filter and emphasize hotter features. The long (1.0 second) exposures are taken through a thin polyimide filter and emphasize cooler features. The improved dynamic range and sensitivity of SXI-N over SXI-M is evident below 5 MK. The For comparison to the SXI instruments, the Yohkoh satellite's Soft X-ray Telescope has maximum sensitivity in the 5-15 MK region. The SOHO Extreme Ultraviolet Telescope has a maximum sensitivity from 0.08 to 2.0 MK. Spatial and Temporal Phenomena The rapid cadence of whole-disk images will allow unprecedented study of large scale coronal structures at high time resolution. Instrument Representative Image 10 1 Flares Coronal waves. EIT has observed wave-like disturbances propagating across the solar disk in association with eruptive events. Yohkoh SXT may have detected one of these, but its bandpass is unfavorable for such observations. SXI's bias toward longer wavelengths may enhance its ability to see these phenomena. (EIT image from Thompson et al., ApJ, 517, L151, 1999.) Post-flare loops. SXI will be able to detect post-flare arcades that are indicative of some CME events which are too subtle to distinguish in GOES XRS full-disk data. Plasma Diagnostics 0.1 Full Disk Image Freq. (images/min-1) 0.01 CMEs X-ray emission is the product of the emission measure and a temperature term. With a broadband instrument like SXI, it is possible to deconvolve these two terms using our understanding of optically thin plasmas. Since the observed emission is presumed to arise from a discrete volume of plasma, the emission measure term can be cancelled by obtaining a simple ratio of two filter passbands (e.g., beryllium - be and polyimide - poly). Then, temperature can be uniquely determined by employing a thermal model of optically thin plasma such as that of Mewe et al. Once the temperature is known, the emission measure can be determined. In the box above, for example, a signal of 100 photons detected by SXI-N could represent a cool plasma with a high emission measure or a hot plasma with a low emission measure. The ambiguity in emission measure is removed by knowledge of temperature. 0.001 Operations Research The SXI Program • SXI program requirements are to: • Locate coronal holes for geomagnetic storm forecasts, • Locate flares for solar energetic particle (SEP) event forecasts, • Monitor changes in the corona that indicate coronal mass ejections (CMEs), • Monitor active regions beyond east limb for F10.7 forecasts, and • Assess active region complexity for flare forecasts. The GOES X-ray Sensor (XRS) only provides two numbers to represent solar x-ray activity. Having only XRS data would be analogous to having a microwave sounder with only one pixel for the entire Earth for tropospheric weather forecasts. The figure compares an x-ray image to a time history of GOES XRS data. During the period of the trace, two X-class flares occurred. The image shown is from just after the first flare. Both events occurred in the very bright south-west active region. The location of these events makes them possible sources for a solar energetic particle events. However, the XRS data do not show a moderate brightening of the broad area in the south-east quadrant that could be related to a CME. The image also locates a coronal hole on the east limb. Data Access Active/eruptive structures. SXI will provide consistent, long-term observations of localized active phenomena, such as the evolution of sigmoids (above), eruptive prominences, and other topological changes in rapidly evolving active regions. CME-related activity and signatures. SXI will record other features related to CME eruption, such as large-scale dimmings of the coronal emission and changes in coronal hole and filament channel topology. The figure shows coronal dimming above the bright arcade. Public access to the SXI data will be near real time through the NOAA National Geophysical Data Center (NGDC). Data are written to the NGDC archive at the same time as to the data store at NOAA’s Space Environment Center. The data will be disseminated via the Web. The default Web display will show the most recent sequence of exposure and filter selections as a table of expandable thumbnail images. Users will be able to step though the archive with a programmable interval, i.e., 1-minute, daily, solar rotation, etc. MPEG movies will allow rapid browse. Search capabilities will include: date and time, NOAA/USAF active region number, flare classification, and whole disk XRS or EPS levels, etc. Retrieval methods will include: images in JPEG and FITS format. Large volumes of data will be shipped off-line via CD-R and DVD-R. Exploratory research. SXI will be observing with a cadence and wavelength response that has not been previously utilized, and phenomena that have not previously been observed may be revealed. For example, it is a matter of speculation whether direct observations of CME structures (or significant portions of them) may become visible at these wavelengths. (Images courtesy Yohkoh and LMSAL unless otherwise noted.)