Download

1 / 11
350 likes | 1.17k Views
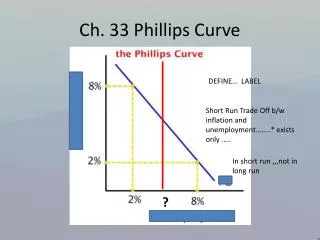
The Phillips Curve. Short Run Phillips Curve. Named for A.W. Phillips, the guy who came up with it. Suggests an inverse relationship between inflation and unemployment. When inflation goes up, unemployment goes down,

E N D
Short Run Phillips Curve • Named for A.W. Phillips, the guy who came up with it. • Suggests an inverse relationship between inflation and unemployment. • When inflation goes up, unemployment goes down, • Can be graphed showing inflation rate on y axis and unemployment rate on x axis
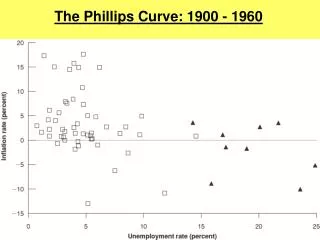
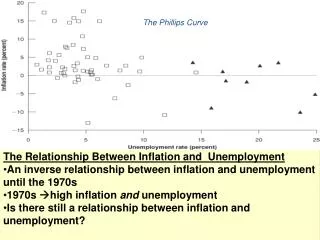
Short Run Phillips Curve • Using this data from the 1960-1969, the year first addressed by Phillips, draw a correctly labeled Phillips curve. Pay attention to labeling the axes. Unemployment rate (%) Inflation rate (%) 5.4 1.7 6.69 1.1 5.57 1.2 5.64 1.2 5.16 1.3 4.51 1.6 3.79 2.9 3.84 3.1 3.56 4.2 3.49 5.5
Short Run Phillips Curve • When drawing the short-run Phillips curve, the the expected inflation rate and the natural unemployment rate are held constant . • For example, we would expect a 2% inflation and 6% unemployment as the natural rate (which means full employment).
Phillips Curve Ch 15, pages 291 • Named for A.W. Phillips who came up with the idea in the 1970s • Shows the relationship between the unemployment rate and the inflation rate • Suggests the relationship is inverse: when one goes up the other goes down • Lower inflation rates are associated with higher unemployment rates
Short Run Phillips Curve • Point A is the expected inflation rate-natural unemployment rate. • An unanticipated increase in aggregate demand makes unemployment decreases and inflation increases—movement to point A2. • These points can also be seen in the AD/AS model Inflation rate (%) A2 A Pe A3 SRPC UN Unemployment rate (%)
Short Run Phillips Curve PL • AD and AS intersect at full employment • Suppose AD is expected to increase. • AD shifts to AD1 • Wages and input prices adjust, SRAS shifts to SRAS1. • Point A in the Phillips curve and the AS/AD SRAS1 LRAS SRAS A2 A A3 AD2 AD1 AD RGDP
Short Run Phillips Curve PL LRAS • Assume AD increase again. • People thought Ad would move to AD1, but it moves to AD2. • Economy moves to point A2 in both graphs. • Unemployment is below natural rate and inflation is above expected rate. SRAS1 SRAS A2 A A3 AD2 AD1 AD RGDP
Short Run Phillips Curve PL LRAS • If policy makers try to keep unemployment rate at the level of A2, people will come to expect the inflation rate associated with A2. • As a result the short run Phillips curve will shift upward and/or outward until the inflation rate associated with A2 is at the natural unemployment rate. SRAS1 SRAS A2 A A3 AD2 AD1 AD RGDP
Short Run Phillips Curve PL LRAS • What will happen if people expect the AD curve to increase and adjust their wages accordingly but in reality AD does not increase? • The economy will move to point A3 • The SRPC is drawn with an expected inflation rate and specific natural rate of unemployment. • The SRPC will shift upward if expected inflation increases • SRPC will shift leftward if natural rate of unemployment decreases. SRAS1 SRAS A2 A A3 AD2 AD1 AD RGDP