Download
1 / 25
250 likes | 330 Views
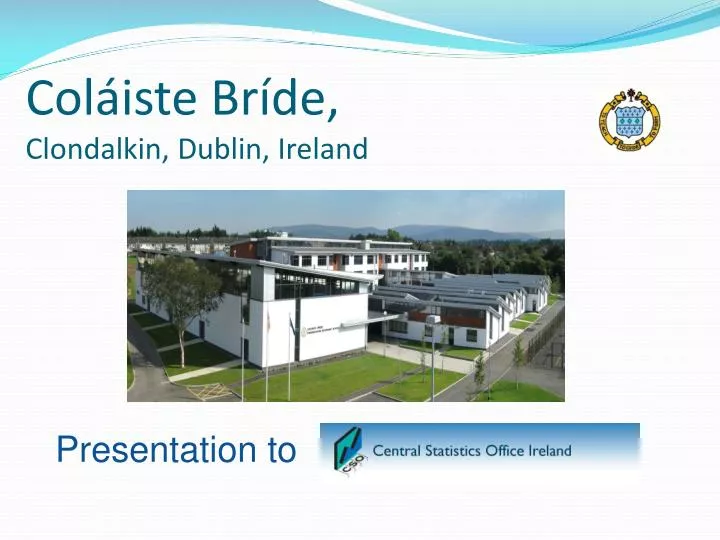
Coláiste Bríde, Clondalkin, Dublin, Ireland. Presentation to. A Case Study In Using Neighbourhood Census Of Population Data As A Tool For School Planning Marie-Thérèse Kilmartin, Principal Sorcha Lowry, Past-Pupil. Profile. Students Over 900 Students 39 Nationalities

E N D
Coláiste Bríde, Clondalkin, Dublin, Ireland Presentation to
A Case Study In Using Neighbourhood Census Of Population Data As A Tool For School Planning Marie-Thérèse Kilmartin, Principal Sorcha Lowry, Past-Pupil
Profile Students • Over 900 Students • 39 Nationalities • 93 International Students • 122 Students with Special Education Needs Staff • 70+ Teaching Staff • 6 Special Needs Assistants • Mixed Age Profile
Profile • Girls only Catholic Secondary School • Founded in 1955 by the Presentation Sisters • New building officially opened May 2008 • State-of-the-Art, modern facilities
The 5 Year Plan – Inspiration & Influences • Autumn 2009 – brand new school • Self-Evaluation Theme – DES Inspectorate • Evaluate what has been achieved • What needs to be done next – vision • Heard about VEC using Census data re planning for a new school in Adamstown • Discovered the range of Census data available at neighbourhoodlevel • 5 Year strategic plan for the school – “Our School - Mapping our Future”
3 Strand Approach • Census neighbourhood data • School designed questionnaire to survey school community • Pupils • Parents • School Staff • Workshop in November 2009 with representatives of the whole school community
Producing “Our School - Mapping our Future” • Sorcha assembled full report on strands 1 & 2 • Analysis of Census data for catchment area of school • Analysis of questionnaires filled out by Pupils Parents and School staff • Analysis of school community meeting by school administration • All 3 strands were brought together in the full report “Our School - Mapping our Future”
Forecasting Enrolment Numbers The age data on female’s under 18 in 2006, suggest that Coláiste Bride should experience an increase in demand for places in 2014 and 2015 and a considerable decrease in 2012
Nationalities & Ethnic Groups More culturally diverse and less racially and ethnically homogenous than the national rate.
Profile of Family Unit Higher proportion of cohabiting couples with children, lone mothers with children and lone fathers with children than the State
PC Ownership & Internet Connectivity Higher rate of PC ownership, internet access and broadband connectivity than the State average but lower than that of South Dublin
Educational Profile Females’ Highest Level of Education Females of the catchment area rank well below the State and South Dublin in terms of 3rd level education
Socio-Economic Group of Reference Person For both males and females, higher proportion of non-manual, skilled manual and semi-skilled workers and lower proportion of professional workers than the State by a half
Socio- Economic Profile Females’ Occupations Lower percentage of female professional workers compared to the State, by almost a half
Uses of the Data - Enrolment • Predict enrolment trends • Based on Census 2006; significant dip predicted for 2011 • However school intake is currently increasing each year • Shows school is desirable • Good for staff and student morale
Uses of the Data - Polish students • Polish predominant EU grouping in the catchment area • Applied to Dept of Education for teaching hours in Polish • Able to prepare school students for Leaving Cert in Polish • First school in the country to do this
Uses of the Data - Third level • Census analysis shows lower levels of Third Level Education in the catchment area • Many of our pupils are first generation attendees at Third Level • School decided to build models of women achieving • Held inaugural careers night in November 2010 • 50 past pupils who have gone on to further education/training attended • Spoke with senior pupils and their parents • Raises awareness among staff also
Uses of the Data - Lone Parents • Census analysis shows higher proportion of Lone Parents • School has used this information to offer a large number of Rainbow groups – Rainbows is a programme which support students in loss, separation and bereavement • Parents and staff are trained to run these programmes
Department of Education Feedback • School and report on RTE news last October for World Statistics Day • Phone calls from staff in Dept of Education asking … is the Census data free? • … is it easily accessible? • Whole school evaluation by DES in January 2011 • “Our School – Mapping our Future” sets out the school’s priorities for development” • “The process review was excellent in that its evidential based included baseline statistical data, including population data and surveys of the partners….”
Other Uses of “Our School - Mapping our Future” in our school • ICT Planning in the school • Development of the Website as a communication tool with parents and students • Awareness of cultural diversity permeates all school planning • Strong community links • Used in Staff Planning
Conclusions • Was this a useful exercise? YES! Most definitely • Can other schools replicate this? Yes! • BUT – perhaps a “How to guide” on the website for school planners? • Project for Transition Year; link to Project Maths (Statistics)? • Presentation by CSO to school principal networks at primary and post-primary level and to ASTI, TUI & INTO conferences
Thank you for your attention. Any Questions?