Download
1 / 30
330 likes | 523 Views
WALLACE RESOURCE LIBRARY Lecture 05 – How to Survey a Coral Reef. This is an ‘example’ of a lecture that is given to A level students as part of their academic lecture series whilst on their expedition.

E N D
WALLACE RESOURCE LIBRARY Lecture 05 – How to Survey a Coral Reef This is an ‘example’ of a lecture that is given to A level students as part of their academic lecture series whilst on their expedition. It has been produced for the exclusive use of the lecturer conducting the series and is solely intended for educational purposes. Most of the material comes from Operation Wallacea sources and any other material that has been used has been credited (as far as is possible) to the appropriate author wherever possible. This lecture is only to be used for EDUCATIONAL purposes.
WALLACE RESOURCE LIBRARY Lecture 05 – How to Survey a Coral Reef
Summary Why do we survey coral reefs? Which method(s) to use? Rapid habitat surveys Benthic and invertebrate assessment techniques Fish assessment techniques Measuring abiotic factors (remember those??) The use of technology The Operation Wallacea reef monitoring program Lecture 5 – How to survey a coral reef
Why do we survey coral reefs? According to the “Status of Coral Reefs of the World: 2008”… • 19% of the world's reefs are effectively lost already • 15% are seriously threatened with loss in the next 10-20 years • 20% are under threat of loss in the next 20-40 years. Surveying and monitoring allows researchers and conservation managers to quantify the state of a coral reef, and decide what action, if any, is needed
Assessing a coral reef • One of the most commonly carried out assessment of reefs is a Rapid Environmental Assessment (RAE) – known as a Survey • Aims to determine the overall community diversity and health of a particular reef system at a particular time • By repeating environmental assessments regularly, ecosystem change can be identified – this is known as ecosystem Monitoring • Operation Wallacea programme is a great example of this Gradient of ecosystem health
Choosing the best method will depend on… The Site: A more remote site will mean extra considerations about the surveying options available to you The experience of the researchers: Some techniques require a higher level of expertise, and so the level of training researchers have had is an important consideration Manpower: How many people are available to you? How can you use their time most effectively? Technique used depends upon… The objectives of the study: What questions are you trying to answer? Is there an aspect of the coral reef which you are particularly interested in? The time available for the study: The more time you have, the more in depth surveying you can do. You need to maximise the amount of data you collect Funding: Some methods cost more than others, plus remember that time costs money!
Broad habitat surveys Site: Buoy 1, Australia Date: 1st August 2012 Reef depth estimate: 4 – 30m Hard coral cover: 60% Soft coral cover: 20% Sand cover: 10% Dominant coral growth type: Massive Signs of bleaching? No Signs of damaged coral? Yes No. Diadema: 21 No. CoTs:35 No. giant clams: 5 • For rapid characterisation of general habitat characteristics i.e. a “look see” • Large area surveyed quickly but data is low quality • Suitable for inexperienced researchers • Often used to identify areas worth surveying in more detail Example data sheet for broad habitat survey
Broad habitat survey: Manta tow • A snorkeller is pulled behind a slow moving boat using a manta board • The distance covered is noted • Researcher notes key features of the reef below them Fun technique – which helps encourage people to get involved!
Broad habitat survey: Spot surveys • These involve descriptive surveys of reef habitats as recorded on set timed spot dives • The information gained is broad but enables key locations to be identified for further study Spot survey results from Puerto Rico, Caribbean (Morelock et al. 2001)
Benthic surveys • Benthic means ”living on the sea bottom” • This includes things like coral and algae, and also those fish and invertebrates that live on the bottom • In terms of surveys, it generally refers to space competitors (hard coral, soft coral, benthic algae, sponge etc.)
Working close to the reef – considerations! Diver damage can be one of the biggest threats to coral reefs Important we think while we dive – we are trying to make things better not worse! • Good buoyancy – will allow you to ‘hover’ above the reef without contact • Horizontal swimming – helps prevent kicking the reef while finning • Dangling equipment – keep all kit tucked in, so it doesn’t hit the reef • Never touch the reef unless you have to – if you have no choice, only use one finger on bare rock to push yourself away • Bubble awareness – bubbles can damage the reef, so avoid swimming under overhangs or into caves • Dangerous organisms – be aware when near the reef, and waft before using the ‘one finger rule’ • Buddy contact – maintain good buddy contact at all times
Benthic transects Transects • Line Intercept Point: Transect is laid out (10 - 50m long) which is marked at set intervals (10 - 100cm) along the transect. At each interval the substratum type underneath each interval is recorded • Continual: Substratum type lying under every part of the tape is recorded. Any change is recorded as transition points Note that both of these can be done using videography, where a recording of the transect is taken and analysed later
Benthic transects Continuous Line Intercept Point Transect Soft Coral Soft Coral (8cm) 20cm Hard Coral Hard Coral (22cm) 20cm Soft Coral (13cm) Soft Coral 20cm Sand (30cm) Sand 20cm Soft Coral 20cm Soft Coral (47cm) Soft Coral 20cm Soft Coral
Methods of assessment Quadrats • Obtain quantitative data • Size and number of replicates depends on habitat, time available and target organisms • Example: 1m x 1m to calculate % benthic cover using photo analysis
Benthic quadrats ?% ?% ?% ?% ?% ?%
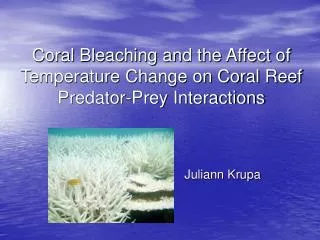
Specific benthic monitoring – coral bleaching • Bleaching is a major problem on reefs (discussed in a later lecture) • Coral Watch Health Charts provide a basic method of identifying bleaching • Users upload results into a central database which monitors global patterns in bleaching • Great tool to raise awareness and provide basic data • However, there are some limitations to this technique e.g. assumes all bleaching is lethal
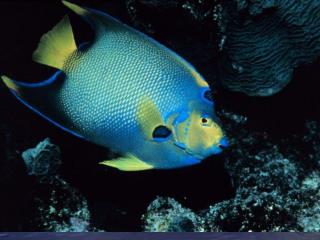
Fish surveys This is an example of swimming along a reef – how would you recommend the fish community could be ACCURATELY surveyed?
Methods to survey fish Destructive Non-destructive Non-destructive techniques do not remove or harm fish in any way Underwater visual census- divers, video cameras Limits the data available, but has little or no impact on the fish community or the reef itself. This is therefore the preferred approach. VS Destructive techniques remove fish and generally kills them Traps, nets, hook and line, rotenone (anaesthetic) Useful for some technical data (e.g. growth rates), but not used otherwise as it requires fish to be killed. Sometimes fishermen will allow their catches to be examined.
Fish survey: Spot surveys • For larger pelagic species, which will tend to disappear soon after the arrival of the survey team • First person in the water immediately looks for and records the presence of pelagic fish species (for a set time) • Often such spot surveys are completed prior to a more detailed survey
Fish transects (also for invertebrates) • Belt transects: Transect laid down and organisms survey either side of the transect for a set distance e.g. 2m either side and above • Time restricted transects: These do not use a transect tape, but involve swimming along the reef at a constant speed for a set time, noting down all fish seen. An estimate of the area covered is then made 25m 2m 2m A transect (black) with the imagined “belt” (red)
Stereo-video • Recent development to survey fish • Twin video camera to provide a stereo-recording • Allows species ID and fish lengths to be analysed post-dive (fish lengths are important to calculate biomass) • Expensive but highly accurate • High quality data can be collected without much experience or expertise
Lets not forget our abiotic factors… • So far in the lectures, you should have noticed how coral reefs are hugely dependent on environmental factors • These include light, temperature, sedimentation and nutrients • These factors can also be monitored using various techniques
Monitoring abiotic factors Water Quality • Inorganic nutrients such as nitrate, phosphate and ammonium can stimulate algal growth • Simple tests can be used to measure the levels of these nutrients in the water Temperature and Light • HOBO loggers (right) can be cemented to the reef, and they will take a temperature and light reading every second for several years! • They can then be brought up and the data downloaded onto a computer
Monitoring abiotic factors Turbidity • Can be measured by filtering large volumes of water and weighing the amount of sediment present • Using a secchi disk (right top) – this is lowered into the water until the pattern is no longer visible, and the depth noted Sedimentation • Sedimentation rates are usually determined by placing sediment traps in the survey area
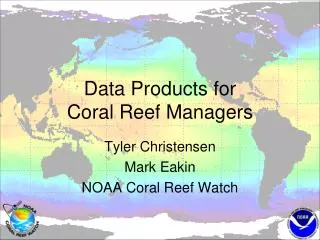
Technology: Remote sensing • Remote sensing utilises satellite photographs of the area under survey • Scientists ground-truth the images by visiting and fixing the position of different habitat types • Software can then match all similar habitat types on the satellite image (by colour) • Therefore the area coverage and exact location can be identified by the map alone Pollution source??
Technology: GIS in marine monitoring GIS can help us identify candidate MPA sites