Download

1 / 19
190 likes | 263 Views
The Southeast Michigan Air Quality Study Group (SEMAQS). George Wolff - AIR, Inc. Joan Weidner - SEMCOG Chuck Hersey - SEMCOG. SEMAQS History. Early days (pre 1990s): Command and Control Communications began after decisions were made A model ripe for confrontation.

E N D
The Southeast Michigan Air Quality Study Group (SEMAQS) George Wolff - AIR, Inc. Joan Weidner - SEMCOG Chuck Hersey - SEMCOG
SEMAQS History • Early days (pre 1990s): Command and Control • Communications began after decisions were made • A model ripe for confrontation
History: Lessons Learned • Confrontation wastes: • Time • Relationship building opportunities • Opportunity to leverage human knowledge and resources
History: The New Age • Tap human knowledge and resources in public and private sector • Work from ground up instead of top down • Create welcoming atmosphere for exchange of information and interpretations of data • SEMOS, now SEMAQS, was formed and working for over 20 years • Resulted in: • Human infrastructure network on regional air quality • Track record of timely NAAQS compliance
Membership • Government • SEMCOG: Local government representative and group facilitator • Michigan Department of Environmental Quality • U.S. EPA • Industry • Autos • Utilities • Other stakeholders (e.g., steel mills) • Other Resources • LADCO • Universities • Canadian national & provincial government • Consultants
Mission • Achieve air quality standards as efficiently, effectively, and swiftly as possible • Develop specific strategies that pass 2 tests: • good science • good policy • Recognize science is rarely deterministic: Focus on weight of evidence • Enjoy and learn from what we do
SEMCOG7-County Planning AreaPopulation: 4,705,000 Ann Arbor Detroit
Pollutants of Concern for SEMAQS • Ozone – Attainment area but 2011 and 2012 violations and lower NAAQS in 2014 possible • Sulfur dioxide – violation at a Detroit site, sparse monitoring in SE MI and modeled violations possible; size of nonattainment area in question • PM2.5 – Awaiting redesignation to attainment, but a probable new NAAQS in 2013 could throw us back into nonattainment • Nitrogen dioxide – Unclassifiable/attainment status • No measured violations but data are sparse • Near roadway monitoring underway • Need more data
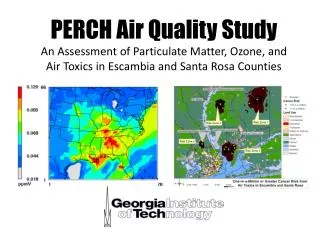
Overarching Areas of Interest • Spatial distribution of pollutions • What can be measured from space? • What is the spatial resolution? • What is the correlation between the vertical slices and surface measurements? • What is the temporal resolution? • What is the analytical resolution? • Effectiveness of emission controls • Are there historical satellite data that can be used to construct pollution trends?
PM2.5 • Trend is down and we expect to meet possible new annual NAAQS in near future with no additional control measures • 24-hour NAAQS is more problematic • Winter episodes poorly understood • High OC and NO3 • Fog appears to contribute to high NO3 • Emission inventories for condensable is woeful • My understanding is that satellite based column profiles correlate poorly with surface measurements (Paciorek & Liu, 2012)
SO2 • SE MI will be declared nonattainment for the new 1-hour NAAQS based on 1 monitor in Detroit • Unlike any other pollutant, an SO2 violation can be based solely on modeling • Therefore spatially resolved data is a high priority
O3 • SE MI barely in attainment with 75 ppb NAAQS in 2008-10 • Violation at 1 site occurred in 2011 and in 2012 • Will be in serious difficulty if NAAQS is lowered
Ingredients for High O3 in SE MI All These Conditions Are Necessary • Persistent S to SW synoptic air flow • Sunny hot days • LAKE BREEZE LAKE BREEZES are inadequately resolved in current Photochemical Grid Models
Other Key Issues -Background O3 • North American Background (NAB) – US concentrations in the absence of NA anthropogenic emissions • NAB sets a limit on the amount of risk that can be reduced. • The lower the NAB, the more risk reduction EPA can claim by lowering the NAAQS • i.e. - If EPA used NAB of 40 ppb instead of 15-35, 92-100% of risk would have disappeared. • NAB establishes the O3 level that can be achieved from State and Federal control Programs • An underestimation of actual NAB will result in failed control strategies.
EPA’s Definition of Background Inappropriate • NAB should not be used • USB should be used because US has no control over Canadian and Mexican emissions • In 1997 O3 review, EPA used modeled mean monthly diurnal NAB profiles (MI ~ 22 ppb) • This grossly underestimates USB daily variability and
Measurement Model NAB USB Canadian/Mexican enhancement • Max USB = 44 ppb (CME = 30; total O3 = 75 ppb) • 5 x’s total O3 ≥ 75 ppb and Canadian enhancement ≥ 10 ppb. • 2x’s Canadian enhancement ≥ 30 ppb. • (from Wang et al., 2009)
Background O3 • Need help getting USB with latest models • Need help convincing EPA that USB not NAB should be used
Are We Calculating USB Correctly? • EPA Zeroing out US anthropogenic emissions creates unrealistic conditions • A more realistic way to determine the impact of upwind emissions on US O3 concentrations would be to zero out upwind emissions and determine the impact by difference
Summary • O3 • Background • Lake breeze • SO2 • Spatial distribution • PM2.5 • Winter episodes • NO2 • Spatial distribution